The Debugger Extension, Part 4: Searching Memory
November 25th, 2005

The Debugger Extension

Now that we know how to solve our problem conceptually, we can put pen to paper. Metaphorically speaking, I suppose. As I said in the last post, our strategy will be to search memory for INT_PTRs matching the MethodTable for our ArbitraryType. When we find matches, we’ll perform some further validation to reduce the likelihood of false positives.

It’s not unreasonable to assume that if we’re successful in writing an extension to look at this class, we might want to do something like it again in the future. So let’s define an interface for commands that search through memory.


    // ------------------------------------------------------
    // SearchCommand.h
    //        Defines the interface for extension commands
    //        that search through memory.
    //
    #pragma once

    class SearchCommand
    {
    public:
        // Called whenever the search pattern is encountered
        // at the provided offset. The method should return
        // true if the offset is a hit.
        virtual bool HandleMatch(ULONG64 offset)=0;

        // Called when the search is finished. The parameter
        // will contain the total number of matches found.
        virtual void ShowResults(int totalHits)=0;
    };


This should give us some flexibility later on if we need it. We can also abstract the process of searching through memory. The DbgEng API that is available to us is the IDebugDataSpaces interface. This defines a SearchVirtual function, which we’ll use to scan for the ArbitraryType's MethodTable. This is its definition.

HRESULT
IDebugDataSpaces::SearchVirtual(
    IN ULONG64  Offset
    IN ULONG64  Length
    IN PVOID  Pattern
    IN ULONG  PatternSize
    IN ULONG  PatternGranularity
    OUT PULONG64  MatchOffset
);

To make our algorithm generic, we’ll add a templated function to our extension class.


    // ------------------------------------------------------
    // dmext.h
    //
    #pragma once
    #include "engextcpp.hpp"
    #include "searchcommand.h"

    class EXT_CLASS : public ExtExtension
    {
    protected:

       // Does a range search for the pattern, keeps track of the hits, and
       // calls methods matching the SearchCommand interface on an instance
       // of the search_command parameter.
       //
       template<class search_command>
       inline void Search(ULONG64 pattern, ULONG64 start, ULONG64 end)
       {
          if( start > end )
          {
             Err("The start cannot be after the end.\n");
             return;
          }

          search_command sc;
          Out("Searching %08I64x to %08I64x.\n", start, end);

          HRESULT hr = 0;
          int hits = 0;
          ULONG64 offs = start;
          do
          {
             hr = m_Data->SearchVirtual(offs,
                end - offs,
                &pattern,
                this->m_PtrSize,
                1,
                &offs);
             if( hr == S_OK )
             {
                if( sc.HandleMatch(offs) )
                {
                   ++hits;
                }

                // Search again, starting at the the next
                // pointer-sized location.
                offs += m_PtrSize;
             }
           }
           while( hr == S_OK );
           sc.ShowResults(hits);
        }

        // Shortcut for an x86 without the /3GB switch.
        template<class search_command>
        inline void Search(ULONG64 pattern)
        {
           this->Search<search_command>(pattern, 0, 0x7fffffff);
        }

     public:
        EXT_CLASS();
        EXT_COMMAND_METHOD(atstat);
    };


I also added a shortcut function that searches all of the virtual memory that is available to user mode. This function assumes that we’re debugging on an Intel x86 machine, and that the process is not LARGEADDRESSAWARE—that is to say, it can’t make use of more that 2 gigabytes of virtual memory.

(A brief aside: although I’m using ULONG64 addresses and other conventions, I’m making no sincere attempt to ensure that this extension will work properly with a 64-bit debuggee. That much should be obvious from my last shortcut. Where I can, I will try to make life easy for someone writing a port.)

We now have enough framework to implement the skeleton of our extension command. For now, we’ll just spit out addresses when we think we have a match.


    // ------------------------------------------------------
    // atstat.cpp
    //
    #include "stdafx.h"
    #include "dmext.h"

    class AtStatCmd : public SearchCommand
    {
    public:
        virtual void ShowResults(int totalHits);
        virtual bool HandleMatch(ULONG64 offset);
        AtStatCmd();
    };

    AtStatCmd::AtStatCmd()
    {
        g_Ext->Out("Searching for ArbitraryTypes...\n");
        g_Ext->Out("--------------------------------------------\n");
    }

    bool AtStatCmd::HandleMatch(ULONG64 offset)
    {
        g_Ext->Out("%08I64x\n", offset);
        return true;
    }

    void AtStatCmd::ShowResults(int totalHits)
    {
        g_Ext->Out("--------------------------------------------\n");
        g_Ext->Out("Found %d total instances.\n\n", totalHits);
    }

    EXT_COMMAND(atstat,
       "Displays statistics about ArbitraryType instances in memory.",
       "{;e;The MethodTable for SampleApp.ArbitraryType.}")
    {
        ULONG64 mt = this->GetUnnamedArgU64(0);
        this->Search<AtStatCmd>(mt);
    }


The !atstat command is defined using the EngExtCpp framework’s macro; this will automatically parse any parameters and provide debugger help. Look in the engextcpp.hpp header for the definition of this macro—I’m not even going to try to explain it here. As you can see, I’ve simplified matters by assuming that we can just retrieve the MethodTable for our type by some other means and provide it to the extension.

Here’s some output of what we have finished so far:

0:000> .load C:\src\samples\dmext\dmext\objfre_wnet_x86\i386\dmext ;
0:000> .load C:\WINDOWS\Microsoft.NET\Framework\v2.0.50727\SOS
0:000> !name2ee!name2ee sampleapp!SampleApp.ArbitraryType
Module: 00912c14 (SampleApp.exe)
Token: 0x02000003
MethodTable: 009131b0
EEClass: 00911410
Name: SampleApp.ArbitraryType

0:000> !atstat!atstat 00912c14
Searching for ArbitraryTypes...
--------------------------------------------
Searching 00000000 to 7fffffff.
0012f560
0012f72c
00167628
0016832c
001685f4
0016860c
00168624
0016abec
0016ae28
009101c0
009101e8
009111f8
00911268
009112d0
00911414
00911478
00913058
00913118
009131c4
00c316b8
--------------------------------------------
Found 20 total instances.

In the next post, we’ll work on trimming down false positives and accomplishing what we set out to do: showing statistics about the “colors” of the ArbitraryTypes.

My Tentative Approval of Visual Studio 2005
November 25th, 2005

Despite some initial bad press, my impression so far is that Visual Studio 2005 is a pretty nice product. I would qualify that by saying that I haven’t yet used it to work on a massive web project, and as we all know web projects were definitely Visual Studio 2003 at its worst. (After two years, I will NOT use Visual Studio 2003 for web projects. I refuse. They were broken. I’m 100% text editor and NAnt from the command line now.)

I am loathe to be seen as a cheerleader, and rest assured I could point to many things about Visual Studio in general and VS2005 specifically that I can’t stand. But somebody out there deserves some credit for the fact that startup performance seems to have been drastically improved. In my informal test (“One Mississippi .. two Mississippi”), VS 2005 outperforms 2003’s startup by an order of magnitude. Two seconds compared to thirty seconds on the same machine. That’s certainly nothing to sneeze at.

You click on the icon, it opens. All software should work this way. I’m looking directly at you, OpenOffice, Trillian, and every single product developed by Adobe. While I’m on the subject, never allowing your program to close is not an acceptable solution to this problem.

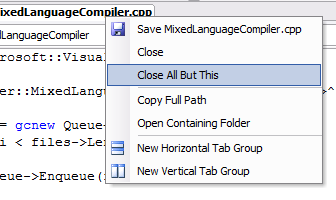
I am also a fan of this:

Visual Studio 2005's "close all but this"

The “close all but this” button replaces these steps:

  1. Ctrl+Shift+S
  2. Ctrl+F4, hold for five seconds
  3. Find the original file and reopen it

The Debugger Extension, Part 3: A Crash Course in .NET Object Layout
November 24th, 2005

The Debugger Extension

To write this extension, we need at least a cursory understanding of the way JIT-compiled objects are represented in memory. The basic structure on a 32-bit machine is:

Offset
        +---------------------+
 +0x0   |  MethodTable*       |
        +---------------------+
 +0x4   |  Field 1            |
        +---------------------+
 +0x8   |  Field 2            |
        +---------------------+
        |  ...                |
        +---------------------+
 +0x4*N |  Field N            |
        +---------------------+

If you are wondering what the method table is, well, it is what it sounds like. It’s a list of pointers to functions that the object defines. And some other stuff. If we wanted to dive deeper into the type metadata that supports Reflection and other magical CLR api’s, the MethodTable is where we would start. But that is beyond the scope of this series.

The object’s fields follow the MethodTable. Types derived from System.ValueType (structures) that are held as fields are inlined into the object instance. So if we have a class that has a DateTime field,

Offset
         +---------------------+
  +0x0   |  MethodTable*       |
         +---------------------+
  +0x4   |  _dt.dateData       |
         |                     |
         +---------------------+
  +0xc   |  Field 2            |
         +---------------------+
         |  ...                |
         +---------------------+
+0x4*N+4 |  Field N            |
         +---------------------+

The datetime field would occupy two slots since it’s a 64-bit value. Reference types (objects) that are held as fields are kept as pointer-sized handles.

The fields may not be in the same order as they are written in the source, but they should be stable from one process to the next. I’m not able to guarantee that since I don’t work for Microsoft and I don’t have access to the source for the CLR’s JIT, but I’ve observed this consistency quite a bit. To view the field layout of any managed type, you can use the !do (DumpObject) command in the SOS extension, or !DumpClass in the same if you do not have an instance handy. Below is the output for an instance of the type we are using in this example, ArbitraryType. This instance has a _color field of zero (Colors.Red) and a _id field of 22.

0:000> !do 012723e4
Name: SampleApp.ArbitraryType
MethodTable: 009131b0
EEClass: 00911410
Size: 16(0x10) bytes
(C:\src\samples\dmext\SampleApp\bin\Release\SampleApp.exe)
Fields:
MT    Field   Offset                 Type VT     Attr    Value Name
00913104  4000006        4         System.Int32  0 instance        0 _color
790fed1c  4000007        8         System.Int32  0 instance       22 _id

We can use the dd command to display the raw memory for the same instance. I’ve added comments here for the object’s data.

0:000> dd /c1 012723e4 l3
012723e4  009131b0        ; MethodTable*
012723e8  00000000        ; _color = (int)Colors.Red = 0
012723ec  00000016        ; _id = 0x16 = 22e

The MethodTable pointer will be the same for each instance of the type, but its value will be different every time you run the program. The constancy of this field enables a nice hack solution to our problem.

Rather than root through the CLR’s internal structures to find ArbitraryType instances, we will simply search memory for DWORDs that look like they’re pointers to the MethodTable for our type. This may result in some bogus hits, but they’ll just be noise.

In the next post in this series, we will actually start coding the extension.

If you are interested in further reading on CLR internals, I recommend this MSDN article and the SSCLI codebase.