The Debugger Extension, Part 6: Scanning Threads
November 26th, 2005
We already have an extension that might be pretty useful in some scenarios, but another common situation is determining what a particular thread is doing. You might want to look at instances of a particular type on the stack of a thread that is maxing out your CPU, or you might want to look at two or more threads that appear to be deadlocked.
We can get something like this out of the extension we have written already if we alter it to search only the stack for the current thread. How do we do that? On an x86 machine, the stack looks something like this:
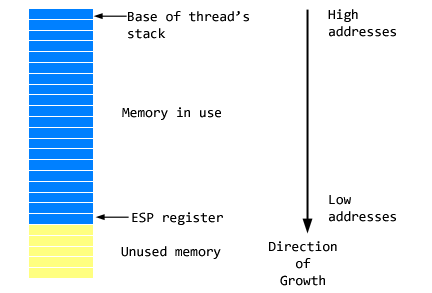
Finding one end of the stack region is very easy. The top of the stack (but the “bottom” address, since the stack grows down) should always be in the ESP register. To get the base of the stack we need to be able to read an NT structure called the Thread Environment Block, or TEB.
The TEB is defined as follows in the Platform SDK.
typedef struct _TEB {
    BYTE Reserved1[1952];
    PVOID Reserved2[412];
    PVOID TlsSlots[64];
    BYTE Reserved3[8];
    PVOID Reserved4[26];
    PVOID ReservedForOle;
    PVOID Reserved5[4];
    PVOID TlsExpansionSlots;
} TEB, *PTEB;
We’re all ecstatic that the TEB is undocumented when this allows the kernel team to freely implement new features, I guess, but this is no help to us right now. This is closer to what the TEB header really looks like.
typedef struct tagTEB_INTERNAL
{
    DWORD dwExceptionList;
    DWORD dwStackBase;
    DWORD dwStackLimit;
    DWORD lpTIB;
    DWORD lpFiberInfo;
    DWORD lpUserPointer;
    DWORD lpSelf;
    DWORD lpEnvironmentPointer;
    DWORD dwProcessId;
    DWORD dwThreadId;
    DWORD dwActiveRPCHandle;
    DWORD lpPEB;
    DWORD dwLastError;
    // More fields follow but are not included here.
} TEB_INTERNAL, *PTEB_INTERNAL;
I took that from chapter six of Microsoft Windows Internals by Mark Russinovich. He’s done many useful and awe-inspiring things besides discovering the Sony Rootkit DRM. The DbgEng SDK exposes a method to us (IDebugSystemObjects::GetCurrentThreadTeb) that makes it trivial to write a function to read in this structure in the debugger (download the source if you want to see it).
We can now write a templated search function (much like those we wrote in part four) to search only the current stack. Since the stack will contain handles/pointers to the objects, we’ll also need a function that searches with a level of indirection.
    // Performs a range search on the current
    // thread's stack.
    //
    template<class search_command>
    inline void SearchStack(ULONG64 pattern)
    {
        TEB_INTERNAL teb = {0};
        HRESULT hr = GetCurrentTEB(&teb);
        if( FAILED(hr) )
        {
            Out("Could not retrieve the TEB.\n");
            return;
        }

        ULONG64 esp = 0;
        hr = m_Registers->GetStackOffset(&esp);
        if( FAILED(hr) )
        {
            Out("Could not read the stack pointer.\n");
            return;
        }
        Out("Thread %d:\n", teb.dwThreadId);

        // Thunk the dword to a 64-bit integer.
        // Otherwise we'll take the previous dword
        // field in the TEB structure with us into
        // the Search call.
        ULARGE_INTEGER li = { teb.dwStackBase, 0L };
        this->SearchPointers<search_command>(
             pattern,
             esp,
             li.QuadPart);
    }

    // Searches for the pattern with a level
    // of indirection.
    //
    template<class search_command>
    inline void SearchPointers(ULONG64 pattern,
         ULONG64 start, ULONG64 end)
    {
        search_command sc;
        int hits = 0;
        for(ULONG64 offs = start;
            offs <= end;
            offs += m_PtrSize)
        {
            ULONG64 ptr = 0;
            HRESULT hr = m_Data->ReadPointersVirtual(
                1L, offs, &ptr);
            ULONG64 ptrVal = 0;
            hr = m_Data->ReadPointersVirtual(
                1L, ptr, &ptrVal);
            if( hr == S_OK && ptrVal == pattern )
            {
                if( sc.HandleMatch(ptr) )
                {
                    ++hits;
                }
            }
        }
        sc.ShowResults(hits);
    }
The EngExtCpp framework makes it very easy to add a switch to enable searching with this method:
0:000> !atstat /?
!atstat [/s] <The MethodTable for SampleApp.ArbitraryType.>
  <The MethodTable for SampleApp.ArbitraryType.>
  /s - Searches only the current stack.
Displays statistics about ArbitraryType instances in memory.
That lets us build some cool composite commands in WinDbg like this:
0:000> ~*e!atstat /s 009131b0
Thread 2624:
Searching for ArbitraryTypes...
--------------------------------------------
01272bf8 : Purple
01272bf8 : Purple
01272bdc : Blue
01272bf8 : Purple
--------------------------------------------
Found 4 total instances.
Totals:
Blue: 1
Purple: 3

Thread 1924:
Searching for ArbitraryTypes...
--------------------------------------------
--------------------------------------------
Found 0 total instances.
Totals:

Thread 2096:
Searching for ArbitraryTypes...
--------------------------------------------
--------------------------------------------
Found 0 total instances.
Totals:
I think that’s where we’ll leave it for now. Not bad for a day of work or so, when you consider that we’re empowered to crank out similar utilities in no time at all. I hope you’ve enjoyed the debugger extension series.
