Here’s the scenario: I had about eight hours of perfmon output, for several hundred counters sampled once per second. I wanted to put this into a database already containing the parsed IIS logs from the same machine, to try to correlate some of the resource utilization peaks with URL’s.
The only snag was that Microsoft’s LogParser couldn’t handle the CSV files that perfmon generated. The input lines were far too long for it.
The call is from heroism. Will you accept the charges?
The solution I came up with was to hack together an MSH script that processed the files. It’s not pretty (because it didn’t have to be), but here it is.
    #
    # trim-perflog.msh
    #   This pares down a set of enormous perfmon logs to a
    #   size that can be managed by the Microsoft LogParser.
    #
    #   This finds the column indices that we're interested in,
    #   then runs through each line in the input CSV file(s)
    #   and pulls them out.
    #

    # The counters in the perfmon trace that we're interested in.
    #
    $counters =
    "(PDH-CSV 4.0) (Eastern Standard Time)(300)",
    "\\machine\.NET CLR Exceptions(w3wp)\# of Exceps Thrown / sec",
    "\\machine\.NET CLR LocksAndThreads(w3wp)\Contention Rate / sec",
    "\\machine\.NET CLR Memory(w3wp)\% Time in GC",
    "\\machine\.NET CLR Remoting(w3wp)\Remote Calls/sec",
    "\\machine\Process(w3wp)\Page Faults/sec",
    "\\machine\Process(w3wp)\% Processor Time",
    "\\machine\Process(w3wp)\% User Time",
    "\\machine\Process(w3wp)\% Privileged Time",
    "\\machine\Process(w3wp)\Private Bytes";

    # Prettier names for the counters.
    #
    $columnAlias = "time", "exceptionsPerSecond",
    "contentionPerSecond", "pctTimeInGC",
    "remoteCallsPerSecond", "pageFaultsPerSecond",
    "pctProcessorTime", "pctUserTime",
    "pctPrivelegedTime", "privateBytes";

    # Returns an array that contains the index of each of the
    # $counters in the csv.
    #
    function getPerflogIndices
    {
        param([System.String]$columns)

        $tokens = $columns.Split(',');
        for($i = 0; $i -lt $tokens.Length; $i++)
        {
            $t = $tokens[$i];
            $t = $t.Substring(1, $t.Length-2);
            $index = -1 ;
            for($j = 0; $j -lt $counters.Length; $j++)
            {
                if($t -eq $counters[$j])
                {
                    $index = $j;
                }
            }
            if($index -ge 0)
            {
                write-object $i;
            }
        }
    }

    # writes a CSV line using the values in $array.
    #
    function write-array
    {
        param([System.IO.StreamWriter]$writer, $array)
        $j = 0;
        $last = $array.Length;
        foreach($a in $array)
        {
            $writer.Write($a);
            if($j -ne $last)
            {
                $writer.Write(",");
            }
            $j++;
        }
        $writer.WriteLine();
    }

    # Writes a single line to the result CSV file.
    # This requires:
    #    $writer  - The output stream.
    #    $ln      - A single line read from
    #                the input stream.
    #    $indices - The column indices of the
    #                  subject perfmon counters.
    #
    function write-csv-line
    {
        param([System.IO.StreamWriter]$writer,
           [System.String]$ln, [System.Object[]]$indices)

        $vals = $ln.Split(',');
        $j = 0;
        $last = $indices.Length - 1;
        foreach($i in $indices)
        {
            $writer.Write($vals[$i]);
            if($j -ne $last)
            {
                $writer.Write(",");
            }
            $j++;
        }
        $writer.WriteLine();
    }

    # Trims down the input CSV file. If $names is True,
    # writes the names of the columns as the first line
    # in the output.
    function trim-perflog
    {
        param([System.IO.FileInfo]$in, [System.Boolean]$names)

        $r = $in.OpenText();
        $ln = $r.ReadLine();
        $indices = getPerfLogIndices $ln;

        $wr = [System.IO.File]::AppendText($out);
        if($names)
        {
            write-array $wr $columnAlias;
        }
        while($r.Peek() -ge 0)
        {
            write-csv-line $wr $r.ReadLine() $indices;
        }
        $wr.Close();
    }

    $out = "c:\perflogs\output.csv";

    trim-perflog c:\perflogs\prod_000005.csv True
    trim-perflog c:\perflogs\prod_000006.csv False
    trim-perflog c:\perflogs\prod_000007.csv False
We already have an extension that might be pretty useful in some scenarios, but another common situation is determining what a particular thread is doing. You might want to look at instances of a particular type on the stack of a thread that is maxing out your CPU, or you might want to look at two or more threads that appear to be deadlocked.
We can get something like this out of the extension we have written already if we alter it to search only the stack for the current thread. How do we do that? On an x86 machine, the stack looks something like this:
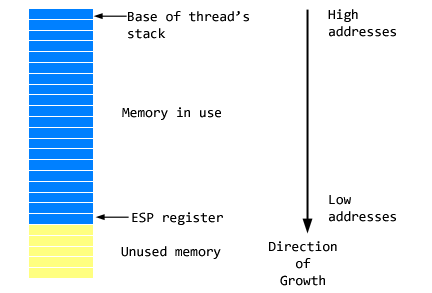
Finding one end of the stack region is very easy. The top of the stack (but the “bottom” address, since the stack grows down) should always be in the ESP register. To get the base of the stack we need to be able to read an NT structure called the Thread Environment Block, or TEB.
The TEB is defined as follows in the Platform SDK.
typedef struct _TEB {
    BYTE Reserved1[1952];
    PVOID Reserved2[412];
    PVOID TlsSlots[64];
    BYTE Reserved3[8];
    PVOID Reserved4[26];
    PVOID ReservedForOle;
    PVOID Reserved5[4];
    PVOID TlsExpansionSlots;
} TEB, *PTEB;
We’re all ecstatic that the TEB is undocumented when this allows the kernel team to freely implement new features, I guess, but this is no help to us right now. This is closer to what the TEB header really looks like.
typedef struct tagTEB_INTERNAL
{
    DWORD dwExceptionList;
    DWORD dwStackBase;
    DWORD dwStackLimit;
    DWORD lpTIB;
    DWORD lpFiberInfo;
    DWORD lpUserPointer;
    DWORD lpSelf;
    DWORD lpEnvironmentPointer;
    DWORD dwProcessId;
    DWORD dwThreadId;
    DWORD dwActiveRPCHandle;
    DWORD lpPEB;
    DWORD dwLastError;
    // More fields follow but are not included here.
} TEB_INTERNAL, *PTEB_INTERNAL;
I took that from chapter six of Microsoft Windows Internals by Mark Russinovich. He’s done many useful and awe-inspiring things besides discovering the Sony Rootkit DRM. The DbgEng SDK exposes a method to us (IDebugSystemObjects::GetCurrentThreadTeb) that makes it trivial to write a function to read in this structure in the debugger (download the source if you want to see it).
We can now write a templated search function (much like those we wrote in part four) to search only the current stack. Since the stack will contain handles/pointers to the objects, we’ll also need a function that searches with a level of indirection.
    // Performs a range search on the current
    // thread's stack.
    //
    template<class search_command>
    inline void SearchStack(ULONG64 pattern)
    {
        TEB_INTERNAL teb = {0};
        HRESULT hr = GetCurrentTEB(&teb);
        if( FAILED(hr) )
        {
            Out("Could not retrieve the TEB.\n");
            return;
        }

        ULONG64 esp = 0;
        hr = m_Registers->GetStackOffset(&esp);
        if( FAILED(hr) )
        {
            Out("Could not read the stack pointer.\n");
            return;
        }
        Out("Thread %d:\n", teb.dwThreadId);

        // Thunk the dword to a 64-bit integer.
        // Otherwise we'll take the previous dword
        // field in the TEB structure with us into
        // the Search call.
        ULARGE_INTEGER li = { teb.dwStackBase, 0L };
        this->SearchPointers<search_command>(
             pattern,
             esp,
             li.QuadPart);
    }

    // Searches for the pattern with a level
    // of indirection.
    //
    template<class search_command>
    inline void SearchPointers(ULONG64 pattern,
         ULONG64 start, ULONG64 end)
    {
        search_command sc;
        int hits = 0;
        for(ULONG64 offs = start;
            offs <= end;
            offs += m_PtrSize)
        {
            ULONG64 ptr = 0;
            HRESULT hr = m_Data->ReadPointersVirtual(
                1L, offs, &ptr);
            ULONG64 ptrVal = 0;
            hr = m_Data->ReadPointersVirtual(
                1L, ptr, &ptrVal);
            if( hr == S_OK && ptrVal == pattern )
            {
                if( sc.HandleMatch(ptr) )
                {
                    ++hits;
                }
            }
        }
        sc.ShowResults(hits);
    }
The EngExtCpp framework makes it very easy to add a switch to enable searching with this method:
0:000> !atstat /?
!atstat [/s] <The MethodTable for SampleApp.ArbitraryType.>
  <The MethodTable for SampleApp.ArbitraryType.>
  /s - Searches only the current stack.
Displays statistics about ArbitraryType instances in memory.
That lets us build some cool composite commands in WinDbg like this:
0:000> ~*e!atstat /s 009131b0
Thread 2624:
Searching for ArbitraryTypes...
--------------------------------------------
01272bf8 : Purple
01272bf8 : Purple
01272bdc : Blue
01272bf8 : Purple
--------------------------------------------
Found 4 total instances.
Totals:
Blue: 1
Purple: 3

Thread 1924:
Searching for ArbitraryTypes...
--------------------------------------------
--------------------------------------------
Found 0 total instances.
Totals:

Thread 2096:
Searching for ArbitraryTypes...
--------------------------------------------
--------------------------------------------
Found 0 total instances.
Totals:
I think that’s where we’ll leave it for now. Not bad for a day of work or so, when you consider that we’re empowered to crank out similar utilities in no time at all. I hope you’ve enjoyed the debugger extension series.
In the last post in this series, we succeeded in writing a working extension that searched memory for instances of a particular type. Trouble is, we haven’t done anything useful yet. We’ve merely duplicated a very small subset of the functionality offered by SOS’s !DumpHeap command, and poorly at that.
In the problem setup, we said we wanted to show statistics about a particular property of these instances—for the purposes of this example, we’re calling that their “Color.” A sensible step in this direction would be to write some utility C++ code to accompany the Colors enumeration that we wrote earlier in C#.
    // Some definitions that correspond to the managed
    // SampleApp.Colors enum.
    typedef ULONG Color;
    const Color COLOR_RED = 0;
    const Color COLOR_GREEN = 1;
    const Color COLOR_BLUE = 2;
    const Color COLOR_PURPLE = 3;
    const Color MAX_COLOR = COLOR_PURPLE;

    PCSTR g_szColorNames[] = { "Red", "Green",
        "Blue", "Purple" };

    bool IsColor(Color c)
    {
        if( c <= MAX_COLOR )
        {
            return true;
        }
        return false;
    }

    PCSTR ColorName(Color c)
    {
        if( !IsColor(c) )
        {
            return NULL;
        }
        return g_szColorNames[static_cast<int>(c)];
    }
Part of the point of this series has been to develop a framework that deals with instances of .NET objects. To that end, we should try to write a generic base class that loads a managed instance in the debuggee into the debugger’s process. This is my implementation of such a class.
    // ------------------------------------------------------
    // mtypes.h
    //        Some base classes for dealing with instances
    //        of managed objects.
    //
    #pragma once

    template<class object_fields>
    class ManagedInstance
    {
    protected:
        object_fields m_Fields;
        ULONG64 m_offset;
        bool m_valid;

        // Can be used by derived classes can to refer
        // to this class.
        typedef ManagedInstance<object_fields> base_t;

        // Constructor - pass the offset of the managed
        // object. Check the result of IsValid() before
        // using an instance derived from this class.
        ManagedInstance(ULONG64 offset) : m_Fields()
        {
            // Load the data for the fields from the
            // debugee process / memory dump
            IDebugDataSpaces* pData = g_Ext->m_Data;
            m_offset = offset;
            ULONG read = 0L;
            HRESULT hr = pData->ReadVirtual(
                m_offset,
                reinterpret_cast<void*>(&m_Fields),
                sizeof(object_fields),
                &read);
            m_valid = SUCCEEDED(hr) &&
                (read == sizeof(object_fields));
        }

        virtual ~ManagedInstance() {}

    public:
        // Returns true if the object was successfully
        // read from the debugee. Doesn't validate that
        // it actually is a managed object of the desired
        // type, but overridden implementations should
        // do this.
        virtual bool IsValid() { return m_valid; }
    };

    // This can be used as a base class for classes used
    // as the object_fields template parameter.
    class ObjectFields
    {
    public:
        ULONG pMethodTable;
    };
The template parameter for the ManagedInstance class takes a POD (“plain old data”) type that should just list the fields in the instance. The constructor for ManagedInstance loads the data at the specified offset as those fields. I declared a virtual function that indicates whether or not the managed instance is valid. In this base class, all we can really say about that is whether or not we could read the data at the provided address.
I’ve also defined a base class for the fields of a managed object, and put the MethodTable address in it. Given these classes, it’s not a lot of work to write the implementations for ArbitraryType.
    // Represents the fields of a
    // SampleApp.ArbitraryType instance.
    class ArbitraryTypeFields
         : public ObjectFields
    {
    public:
        Color col;
        ULONG id;
    };

    // Represents a single ArbitraryType instance.
    class ArbitraryType :
        public ManagedInstance<ArbitraryTypeFields>
    {
    public:
        ArbitraryType(ULONG64 offset)
            : base_t(offset) {}
        virtual bool IsValid();
        Color GetColor() { return m_Fields.col; }
    };

    // Returns true if the loaded data is a valid
    // ArbitraryType instance.
    bool ArbitraryType::IsValid()
    {
        if( base_t::IsValid() &&
            IsColor(m_Fields.col) )
        {
            return true;
        }
        return false;
    }
In the last post, the only criteria we used for finding ArbitraryType instances was that we had found a INT_PTR containing the address of its MethodTable. That’s obviously going to result in false positives, because the CLR’s execution engine will certainly have this pointer in several places in its own internal data structures. We can do a little better now by making sure that the Color field is within the range of expected values. While we’re changing our HandleMatch function to implement this, we’ll add an STL map to the mix to keep track of the colors we find.
    class AtStatCmd : public SearchCommand
    {
    protected:
        typedef map<Color, int>  CountMap_t;
        CountMap_t m_counts;

    public:
        virtual void ShowResults(int totalHits);
        virtual bool HandleMatch(ULONG64 offset);
        AtStatCmd();
    };

    bool AtStatCmd::HandleMatch(ULONG64 offset)
    {
        ArbitraryType at(offset);
        if( at.IsValid() )
        {
            Color c = at.GetColor();
            g_Ext->Out("%08I64x : %s\n",
               offset, ColorName(c));
            m_counts[c]++;
            return true;
        }
        return false;
    }
The output of the extension in WinDbg now looks like this:
0:000> !atstat!atstat 009131b0
Searching for ArbitraryTypes...
--------------------------------------------
Searching 00000000 to 7fffffff.
009100cc : Red
009130e0 : Red
01271ce4 : Red
01271d00 : Blue
01271d1c : Red
01271d38 : Blue
01271d54 : Red
--------------------------------------------
Found 7 total instances.
Totals:
Red: 5
Blue: 2
There’s one obvious problem with this that I can think of, and that is the fact these objects are not necessarily alive (rooted) on the GC heap. They could very well be collected and sitting in freed memory. In my case, this is not a concern since I am interested mostly in debugging leaked memory. This may be an issue for other users, however.
Since the extension we set out to build is basically complete, I’ll post the code now even though I have one more feature in mind for the next post. You can download the code here.
