There were rumblings earlier this week that Alphabet executives mused
about killing GCP.
I think they probably won’t do it [1]. But
as a side effect this has provoked yet another round
of everyone pouring one out for
the most beloved Google ex-feature ever, Google Reader.
I miss the RSS world of the early 2000’s as much as anyone. I miss it almost
as much as I miss McCarren Pool having no water in it and new Spoon albums
sounding fresh. This is why I feel compelled to point out that those mourning
Google Reader are forgetting that it was actually responsible for ruining the
whole thing.
Computer, engage shitpost. Attack pattern "digging up graves."
It went like this: Google Reader killed RSS, and then like a decade later Google
killed Google Reader. You’re having a funeral for the tame old fox that was
mysteriously living in your henhouse.
A Bull Moose Stomping around the Primordial Tidepool
The existence of Google Reader wiped out a generation of attempts at building
hosted, social feed readers. I was working on one. We had maybe a thousand users,
so I’m not trying to overestimate the cardinality of the set of alternate universes in
which ours won. But the survival of any of them as independent actors became untenable
once Google Reader came out.
Hosted feed aggregation was a relatively expensive product to attempt at the time.
There were no clouds yet, and bandwidth pricing on shared hosts was oppressive to
those of us just getting by on bootstrapped budgets. Everyone subscribed to less
than a hundred feeds, but it was fat-tailed and everyone chose a different set of
less than a hundred feeds. Your servers had to download a lot of stuff, and they had
to do it as often as you could afford.
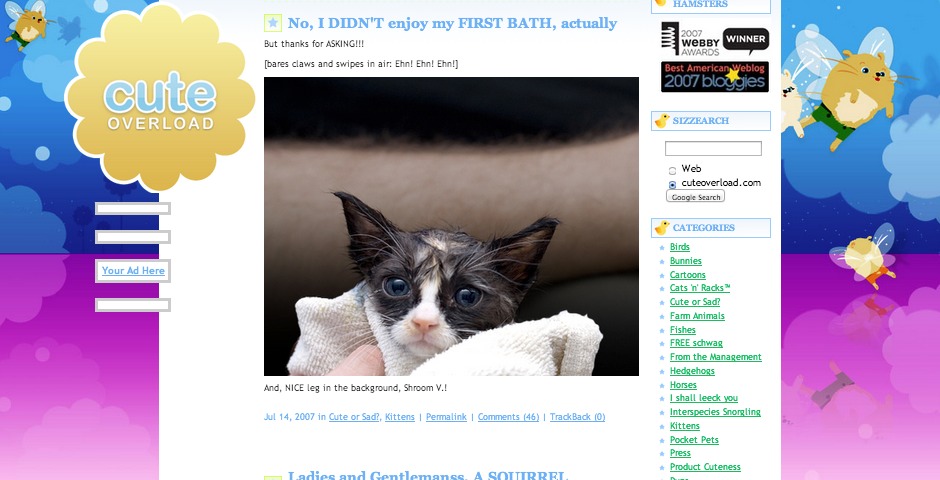
There was a significant amount of toil involved in maintaining the perception of quality,
because blogging software was a much more fragmented space then, and feeds of the era were a
mess. Remember Cute Overload?
I do, mainly because it was a freaking frameset around a blogger site. This kind of
kluge was typical [2].
mfw we realized it was a freaking frameset
As long as Google Reader existed, the two available paths out of this were out of
reach. Anyone with money who believed in RSS as a consumer technology also believed
Google would dominate the space
[3].
The aura of infallability that Google possessed in this era before laughingstocks
like Glass,
Google+,
Wave, etc, is hard to relate.
Picture showing up for an audition and getting in line behind Denzel Washington.
And of course you couldn’t charge a fee, because Google Reader was free.
Google Reader: Not Impressive
This all would have been water under the bridge if Google had followed through
with making Reader what it deserved to be. But they did not. They kept it on
starvation rations for more than ten years.
Reader’s social features, for example, were only slightly less catastrophically haphazard than Buzz.
What passed as the social features of Reader ca. 2008
For years and years it wasn’t even obvious how the friend list worked, at all.
If you check the associated help page, it turns out that to remove someone, you have
to remove them as a Gmail/Google Talk contact. Wow.
Despite this, people out there lament the loss of the communities they’d built on
Reader. It’s frankly incredible that anyone managed this with tools this bad.
It validates that there was something there, something that could have been more
than what we got.
Hello from a Smoking Crater Inside the Kill Zone
Google Reader reigned for so long that people towards the end of its run weren’t
wistful for a return to the old ways. They were wistful for the thing that
wrecked the old ways. The old ways were a world not even remembered.
Allowing Reader to exist, but not attempting to make it something that could
achieve broader adoption–or even just be great inside its niche–was sufficient
to doom the medium. Reader was a worse product than Twitter by the time Twitter
came around. I don’t think it needed to be that way.
I will say that if killing beloved products is your bag, then building a
cloud platform is the smartest strategy because it allows you to shut down
products you don't even own. What legends!
The Daily Kluge, though, ran a tight ship.
This was not wrong at all, but it played out differently than RSS fans expected.
Some folks just didn't believe RSS would work at all, which I think is
somewhat discredited now with the resurgence of podcasts.
The Push Train - Trying to frantically document some of the human element of making engineering function at a high level, which for whatever reason didn’t strike me as vital at the time.
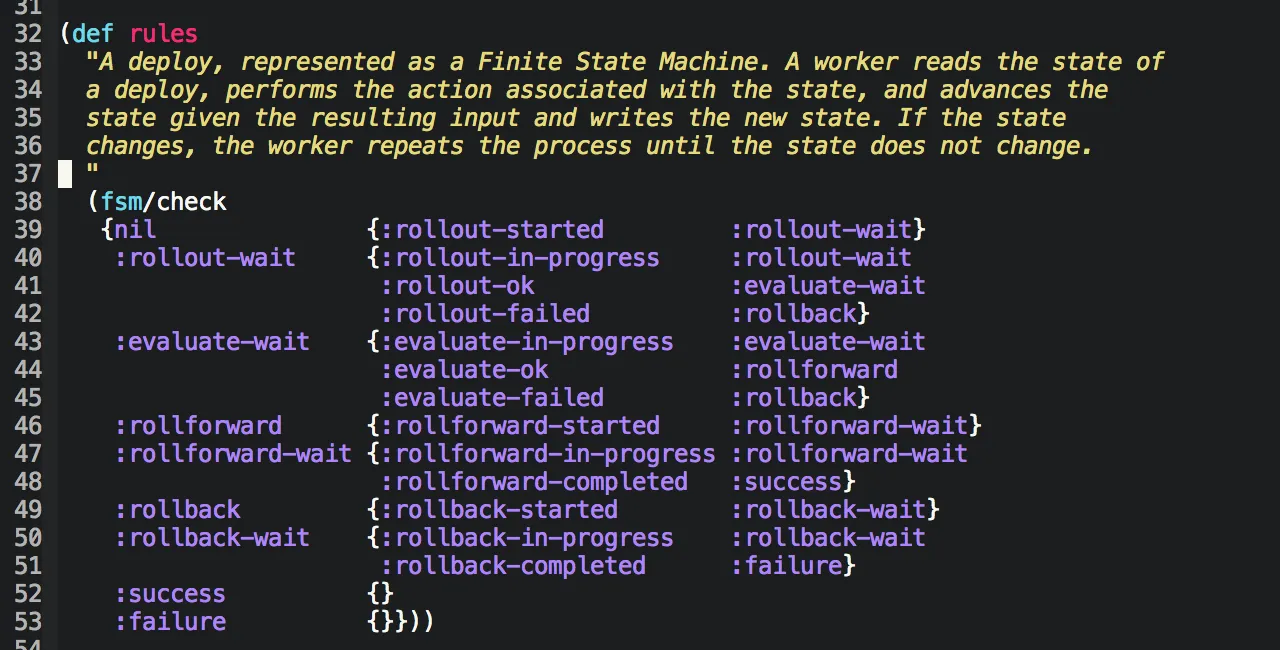
Coda and I have been using Clojure to build Skyliner for the last fourteen months or so. I thought it might be a good idea to write down some of our experiences with this, for the benefit of others considering it for practical work.
The beating heart of Skyliner, a deploy encoded as a finite state machine.
Learning languages is easy, learning the idioms is less easy
“Lisp has no syntax,” or so they say. It does have some, but significantly less than other languages. Clojure has a slightly larger pile of stuff that you could mistake for syntax, but, it’s still compact and simple. The tricky part isn’t the language so much as it is the slang.
As a seasoned engineer who theoretically “knows” a few dozen languages, I got productive with Clojure pretty fast. Nevertheless I definitely emitted some crappy code in my first few months. Stuff like:
This is the kind of thing that would matter to you if you were going to try to onboard a few new engineers a week. I never read a tutorial, because this is a startup, and I did not have time. You’d probably want to rectify that mistake and review their stuff for a while.
When the going gets tough, the tough use maps
If I were going to give you a quick summary of what our codebase is like, I’d say it’s procedural code that manipulates maps. That is literally 90% of it. This is a lot less bad than it probably sounds if you’ve never written Clojure, because the entire language is oriented around manipulating maps and lists.
We keep the wheels on a few ways.
Schemas for our maps are pretty handy, particularly when they’re of the user-supplied data variety. We’re using prismatic/schema for this, although if we were starting today we might use clojure.spec.
Our codebase has better test coverage than nearly anything I’ve ever worked on.
We use Kibit and Eastwood in our build pipeline for the sake of general cleanliness.
Bells and whistles are very rare
I kind of assumed writing Clojure professionally would involve communing with the grand harmony of the spheres, or something, but it really doesn’t. And this isn’t bad. It is actually extremely good.
In fourteen months I count about six uses of recur. I think I wrote some code using trampoline once or twice and then decided against shipping it.
We’ve written defmacro ourselves less than ten times. Most of those are for logging, so that we can grab the caller’s value of *ns*. Others are setting dynamically scoped variables for the sake of implementing feature flags. They’re all really simple macros.
Types of any kind are rare to a degree that astonish me. We’ve written a handful of protocols, for example our scm protocol is there to provide a uniform interface for both GitHub and private git repos. We have records representing different kinds of CloudFormation stacks that we create and manipulate. That is pretty much it.
Multimethods are less rare
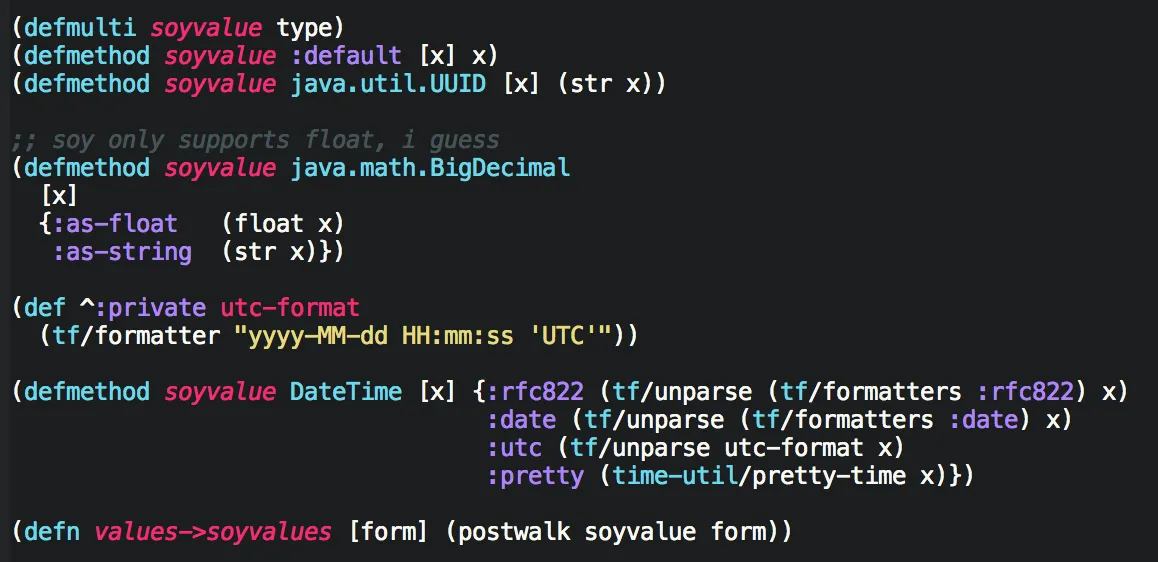
One thing we do use more extensively are multimethods. We use this to dispatch asynchronous jobs in our workers, to fan out to different handlers from webhook endpoints, and to make transitions in our deploy finite state machine.
Using a simple little multimethod to convert java types into primitives that are acceptable to our frontend templates.
In other languages we’d probably want to use some object abstraction or other, but multimethods handle things like this cleanly.
Clojure is not Scala
I had some anxiety when we were getting started with Clojure, and that was grounded in my years of experience with Scala. Scala has scarred both of us for a number of reasons. Scala builds on JVM typing to erect additional complexity, and in my opinion the results are mixed.
A cathedral of covariance and contravariance built on the soft sandy base layer of type erasure.
Clojure doesn’t ask you to type anything if you don’t want to. That has its pluses and minuses, but you can write most of your code without getting into any slapfights with the JVM. So as a higher-level abstraction over Java, it works.
Building a server application with Clojure is a better experience than with many compiled languages, because as with any Lisp, you can just hotpatch everything in the REPL as you build it.
I’ll grant you that maybe Scala has answers to all of these problems now, as I haven’t had the pleasure of using it in several versions. Do not @ me to talk about this.
Nesting sucks
Although Common Lisp has return-from, Clojure has no facility like return or goto. This isn’t something you miss writing idiomatic Clojure, but sometimes you find yourself boxed into writing non-idiomatic Clojure. A good example of such a situation is dealing with a morass of heterogenous functions that can return error codes.
Let’s say that you have a list of steps that need to complete in a specific order, and may fail. Conceptually, in Python:
We have a decent amount of old code that looks like this. It’s all well tested and in that sense it’s relatively safe, but it’s still craptacular and tricky to modify.
Before a throng of enlightened individuals amble up to the mic stand in the aisle to tell us this, I should say that we are wonk as hell and therefore realized we were building a composition of either monads.
Could you not
But a highbrow-yet-idiomatic solution to that in a language otherwise devoid of category theory wasn’t immediately obvious. I messed around the idea of tackling this with specialized macros, but decided this was an unmaintainable tarpit.
In the end we decided to just try using a category theory library, cats. That lets you write something equivalent to the above like so:
Which cuts out the nesting and makes a big difference in sufficiently complicated scenarios.
It is unclear to me if the category theory would still be a win on a less experienced team. I have a long history of being skeptical of things like this, but it has improved our lives recently.
Thanks for reading!
I hope this helps if you’re considering building something real with Clojure.