If I believed in that sort of thing, I would guess that it said “leave Alphabet City immediately.”
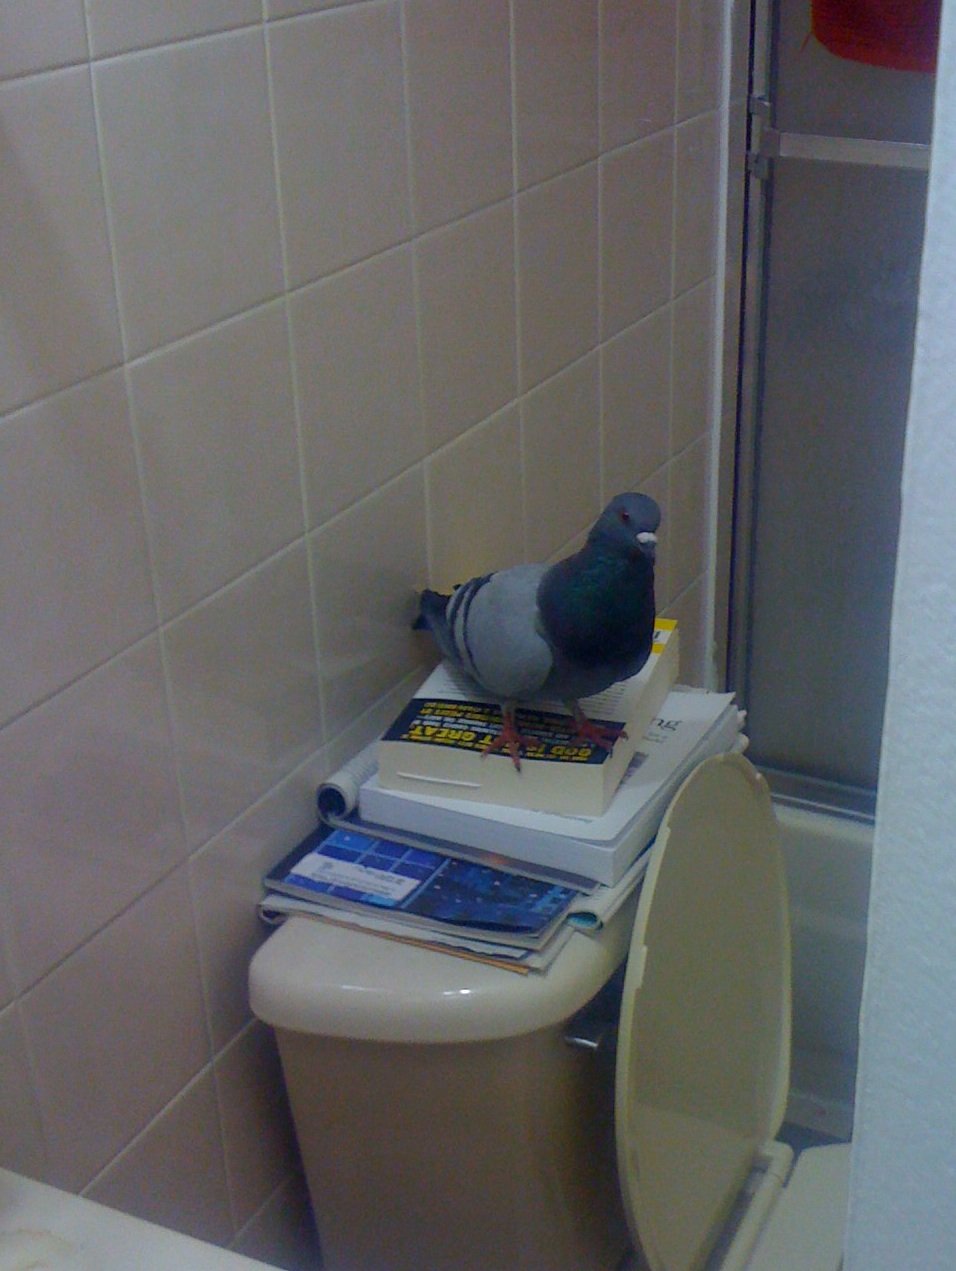
The explanation:
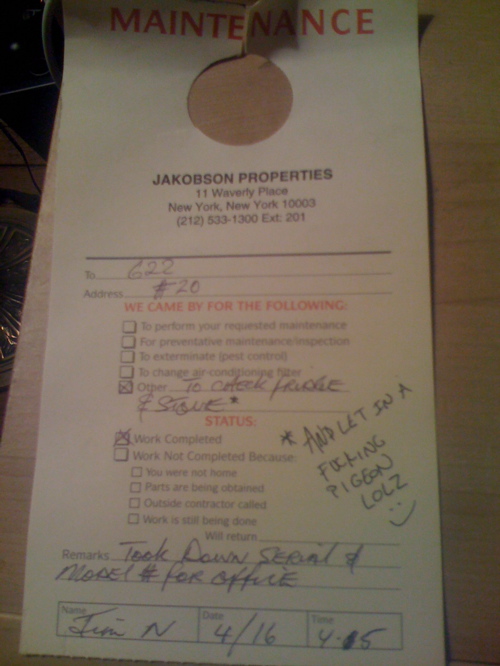
The aftermath:
tabo: is that the erlang book?
---
dan: yes it is
dan: good eye
dan: it has pigeon shit on it now
The Portable Atheist (that yellow book) and a few of my pint glasses appear to have also offended some vengeful, jealous god of pigeons.
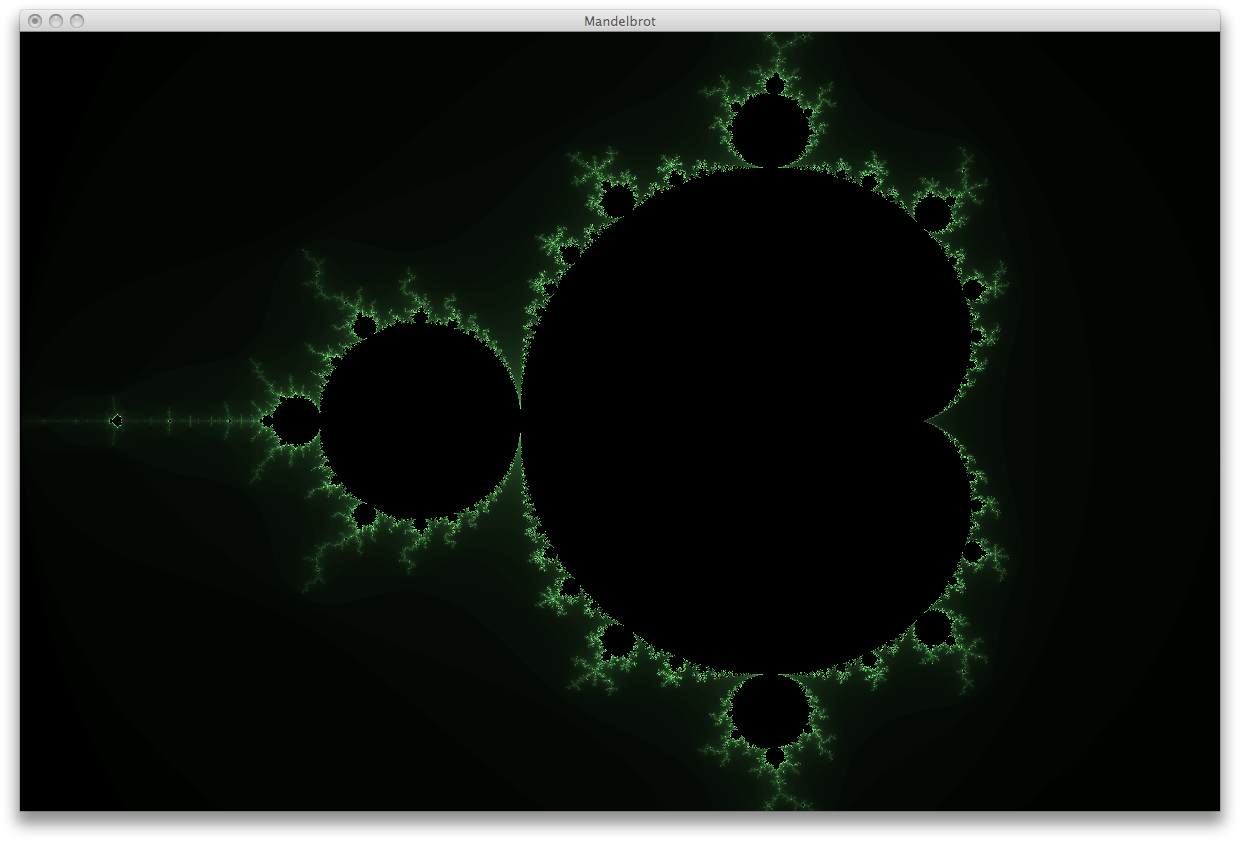
Some people sing carols every XXX-mas, I get bored and write the Mandelbrot Set program in whatever my favorite language happens to be that year. I thought the brevity of the output this year (Haskell) was kinda neat.
import Graphics.UI.GLUT
import Control.Monad
import Data.Int
import Data.Complex

iterations = 400

x // y = fromIntegral x / fromIntegral y

-- Divides [a] into [[a], [a], ...] with each sublist of length n,
-- except the last sublist which has length <= n.
chunkify n [] = []
chunkify n xs = let (xs', rest) = splitAt n xs
                in xs' : chunkify n rest

-- Converts a coordinate in screen space to a vertex.
pix2vert (Size w h) (x, y) = Vertex2 ((3 // w * fromIntegral x) - 2.0)
                             ((2 // h * fromIntegral y) - 1.0)

-- List of all of the vertices that represent screen pixels.
vertices :: IO [Vertex2 GLfloat]
vertices = get windowSize >>= \(Size w h) ->
           return $ [pix2vert (Size w h) (x, y) | x <- [0..w-1], y <- [0..h-1]]

-- Gets the color for a number of iterations.
color3 r g b = Color3 r g b
getcolor :: Int -> Color3 Float
getcolor iter | iter == iterations = color3 0 0 0
              | otherwise          = color3 (amt*0.5) amt (amt*0.5)
              where amt = iter // iterations

-- Returns the number of iterations <= the maximum iterations of the
-- Mandelbrot set at the given vertex.
mandel (Vertex2 r i) = length . takeWhile (\z -> magnitude z <= 2) .
                       take iterations $ iterate (\z -> z^2 + (r :+ i)) 0

-- plots one point.
drawVert v = do color . getcolor $ mandel v
                vertex v

-- draws all the vertices in slices (to update the display while drawing).
display' chunks = do mapM_ (\vs -> do renderPrimitive Points $ mapM_ drawVert vs
                                      flush) chunks
                     displayCallback $= display

-- draws the whole fractal
display = do clear [ ColorBuffer ]
             displayCallback $= (vertices >>= display' . chunkify 256)
             get currentWindow >>= postRedisplay

main = do
   getArgsAndInitialize
   initialDisplayMode $= [ SingleBuffered, RGBMode ]
   initialWindowSize $= Size 1200 1024
   initialWindowPosition $= Position 100 100
   createWindow "Mandelbrot"
   clearColor $= Color4 0 0 0 0
   matrixMode $= Projection
   loadIdentity
   ortho (-2) 1 (-1) 1 (-1) 1
   displayCallback $= display
   mainLoop
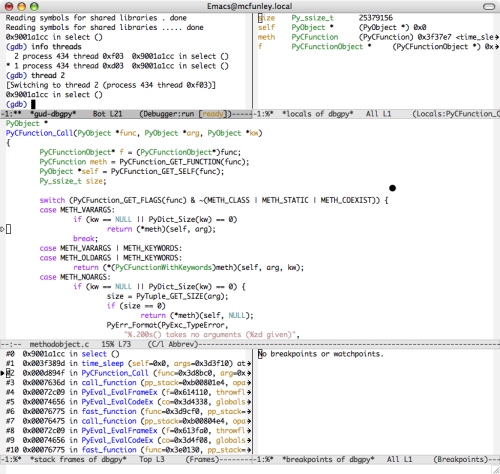
Although I haven’t found this to be necessary nearly as often as Windbg was for me on Windows, it’s still somewhat handy to be able to look at a Python daemon or multithreaded program in GDB. I’ve had to set this up a few times now, and I’ve forgotten the steps each time, so here they are in one place.
Step 1 - Get a debug build of Python.
You need a debug version of the interpreter. This is what I do from source on *nix:
./configure --prefix=/usr/local/dbg
make OPT=-g
sudo make install

sudo ln -s /usr/local/bin/dbgpy /usr/local/dbg/bin/python
Step 2 - Fix the botched .gdbinit that comes with the Python source.
The Python source comes with a .gdbinit file (Misc/gdbinit), but it’s broken in 2.5. Apply these changes, which will fix pystack to 1) work and 2) work on threads other than the main thread.
@@ -119,8 +122,8 @@

 # print the entire Python call stack
 define pystack
-    while $pc < Py_Main || $pc > Py_GetArgcArgv
-        if $pc > PyEval_EvalFrame && $pc < PyEval_EvalCodeEx
+    while ($pc < Py_Main || $pc > Py_GetArgcArgv) && ($pc < t_bootstrap || $pc > thread_PyThread_start_new_thread)
+        if $pc > PyEval_EvalFrameEx && $pc < PyEval_EvalCodeEx
         pyframe
         end
         up-silently 1
@@ -130,8 +133,8 @@

 # print the entire Python call stack - verbose mode
 define pystackv
-    while $pc < Py_Main || $pc > Py_GetArgcArgv
-        if $pc > PyEval_EvalFrame && $pc < PyEval_EvalCodeEx
+    while ($pc < Py_Main || $pc > Py_GetArgcArgv) && ($pc < t_bootstrap || $pc > thread_PyThread_start_new_thread)
+        if $pc > PyEval_EvalFrameEx && $pc < PyEval_EvalCodeEx
         pyframev
         end
         up-silently 1
Note that the locals still won’t work. I’ll post a diff that fixes those when I get around to doing that. In the meantime it’s not too hard to poke through the python structures to get them.
On OS X you can just copy the result of this to ~/.gdbinit. Some linux distros might be cranky about where you put this and where you launch gdb.
Step 3 - Launch your program with the debug interpreter and attach.
From the command line you can attach with “gdb /usr/local/bin/dbgpy [pid].” I like gdba mode in emacs (see below - M-x gdba, then the same kind of command line).