Although I haven’t found this to be necessary nearly as often as Windbg was for me on Windows, it’s still somewhat handy to be able to look at a Python daemon or multithreaded program in GDB. I’ve had to set this up a few times now, and I’ve forgotten the steps each time, so here they are in one place.
Step 1 - Get a debug build of Python.
You need a debug version of the interpreter. This is what I do from source on *nix:
./configure --prefix=/usr/local/dbg
make OPT=-g
sudo make install

sudo ln -s /usr/local/bin/dbgpy /usr/local/dbg/bin/python
Step 2 - Fix the botched .gdbinit that comes with the Python source.
The Python source comes with a .gdbinit file (Misc/gdbinit), but it’s broken in 2.5. Apply these changes, which will fix pystack to 1) work and 2) work on threads other than the main thread.
@@ -119,8 +122,8 @@

 # print the entire Python call stack
 define pystack
-    while $pc < Py_Main || $pc > Py_GetArgcArgv
-        if $pc > PyEval_EvalFrame && $pc < PyEval_EvalCodeEx
+    while ($pc < Py_Main || $pc > Py_GetArgcArgv) && ($pc < t_bootstrap || $pc > thread_PyThread_start_new_thread)
+        if $pc > PyEval_EvalFrameEx && $pc < PyEval_EvalCodeEx
         pyframe
         end
         up-silently 1
@@ -130,8 +133,8 @@

 # print the entire Python call stack - verbose mode
 define pystackv
-    while $pc < Py_Main || $pc > Py_GetArgcArgv
-        if $pc > PyEval_EvalFrame && $pc < PyEval_EvalCodeEx
+    while ($pc < Py_Main || $pc > Py_GetArgcArgv) && ($pc < t_bootstrap || $pc > thread_PyThread_start_new_thread)
+        if $pc > PyEval_EvalFrameEx && $pc < PyEval_EvalCodeEx
         pyframev
         end
         up-silently 1
Note that the locals still won’t work. I’ll post a diff that fixes those when I get around to doing that. In the meantime it’s not too hard to poke through the python structures to get them.
On OS X you can just copy the result of this to ~/.gdbinit. Some linux distros might be cranky about where you put this and where you launch gdb.
Step 3 - Launch your program with the debug interpreter and attach.
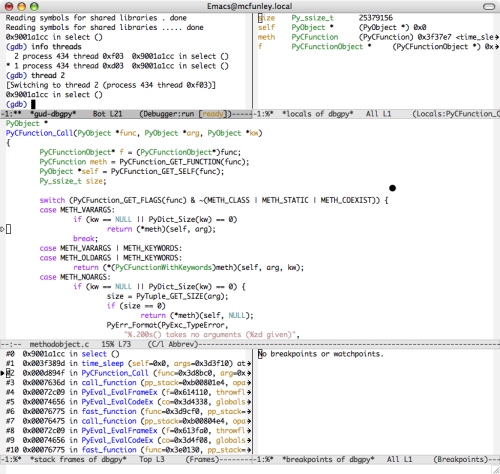
From the command line you can attach with “gdb /usr/local/bin/dbgpy [pid].” I like gdba mode in emacs (see below - M-x gdba, then the same kind of command line).