Homer: There's three ways to do things. The right way, the wrong way, and the Max Power way!
Bart: Isn't that the wrong way?
Homer: Yeah. But faster!
- "Homer to the Max"
Every few months, I try to talk someone down from building a real-time product analytics system. When I’m lucky, I can get to them early.
The turnaround time for most of the web analysis done at Etsy is at least 24 hours. This a ranking source of grousing. Decreasing this interval is periodically raised as a priority, either by engineers itching for a challenge or by others hoping to make decisions more rapidly. There are companies out there selling instant usage numbers, so why can’t we have them?
Here’s an excerpt from a manifesto demanding the construction of such a system. This was written several years ago by an otherwise brilliant individual, whom I respect. I have made a few omissions for brevity.
We believe in…
Timeliness. I want the data to be at most 5 minutes old. So this is a near-real-time system.
Comprehensiveness. No sampling. Complete data sets.
Accuracy (how precise the data is). Everything should be accurate.
Accessibility. Getting to meaningful data in Google Analytics is awful. To start with it’s all 12 - 24 hours old, and this is a huge impediment to insight & action.
Performance. Most reports / dashboards should render in under 5 seconds.
Durability. Keep all stats for all time. I know this can get rather tough, but it’s just text.
The 23-year-old programmer inside of me is salivating at the idea of building this. The burned out 27-year-old programmer inside of me is busy writing an email about how all of these demands, taken together, probably violate the CAP theorem somehow and also, hey, did you know that accuracy and precision are different?
But the 33-year-old programmer (who has long since beaten those demons into a bloody submission) sees the difficulty as irrelevant at best. Real-time analytics are undesirable. While there are many things wrong with our infrastructure, I would argue that the waiting is not one of those things.
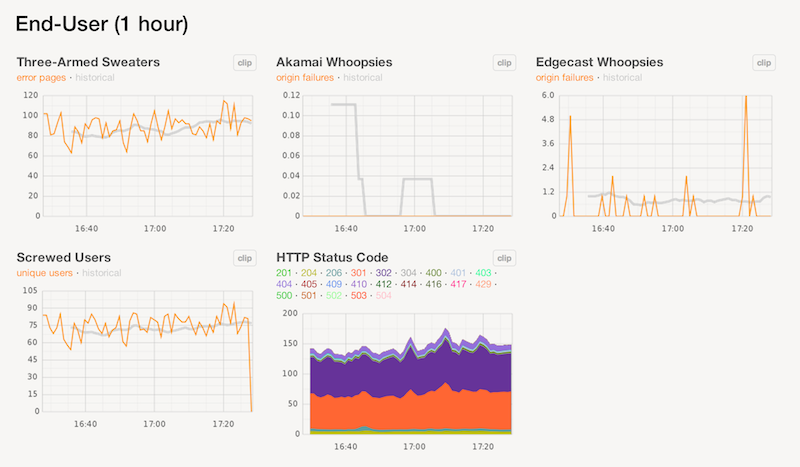
Engineers might find this assertion more puzzling than most. I am sympathetic to this mindset, and I can understand why engineers are predisposed to see instantaneous A/B statistics as self-evidently positive. We monitor everything about our site in real time. Real-time metrics and graphing are the key to deploying 40 times daily with relative impunity. Measure anything, measure everything!
Part of the deploy dashboard at Etsy. We love up-to-the-minute graphs.
This line of thinking is a trap. It’s important to divorce the concepts of operational metrics and product analytics. Confusing how we do things with how we decide which things to do is a fatal mistake.
So what is it that makes product analysis different? Well, there are many ways to screw yourself with real-time analytics. I will endeavor to list a few.
The first and most fundamental way is to disregard statistical significance testing entirely. This is a rookie mistake, but it’s one that’s made all of the time. Let’s say you’re testing a text change for a link on your website. Being an impatient person, you decide to do this over the course of an hour. You observe that 20 people in bucket A clicked, but 30 in bucket B clicked. Satisfied, and eager to move on, you choose bucket B. There are probably thousands of people doing this right now, and they’re getting away with it.
This is a mistake because there’s no measurement of how likely it is that the observation (20 clicks vs. 30 clicks) was due to chance. Suppose that we weren’t measuring text on hyperlinks, but instead we were measuring two quarters to see if there was any difference between the two when flipped. As we flip, we could see a large gap between the number of heads received with either quarter. But since we’re talking about quarters, it’s more natural to suspect that that difference might be due to chance. Significance testing lets us ascertain how likely it is that this is the case.
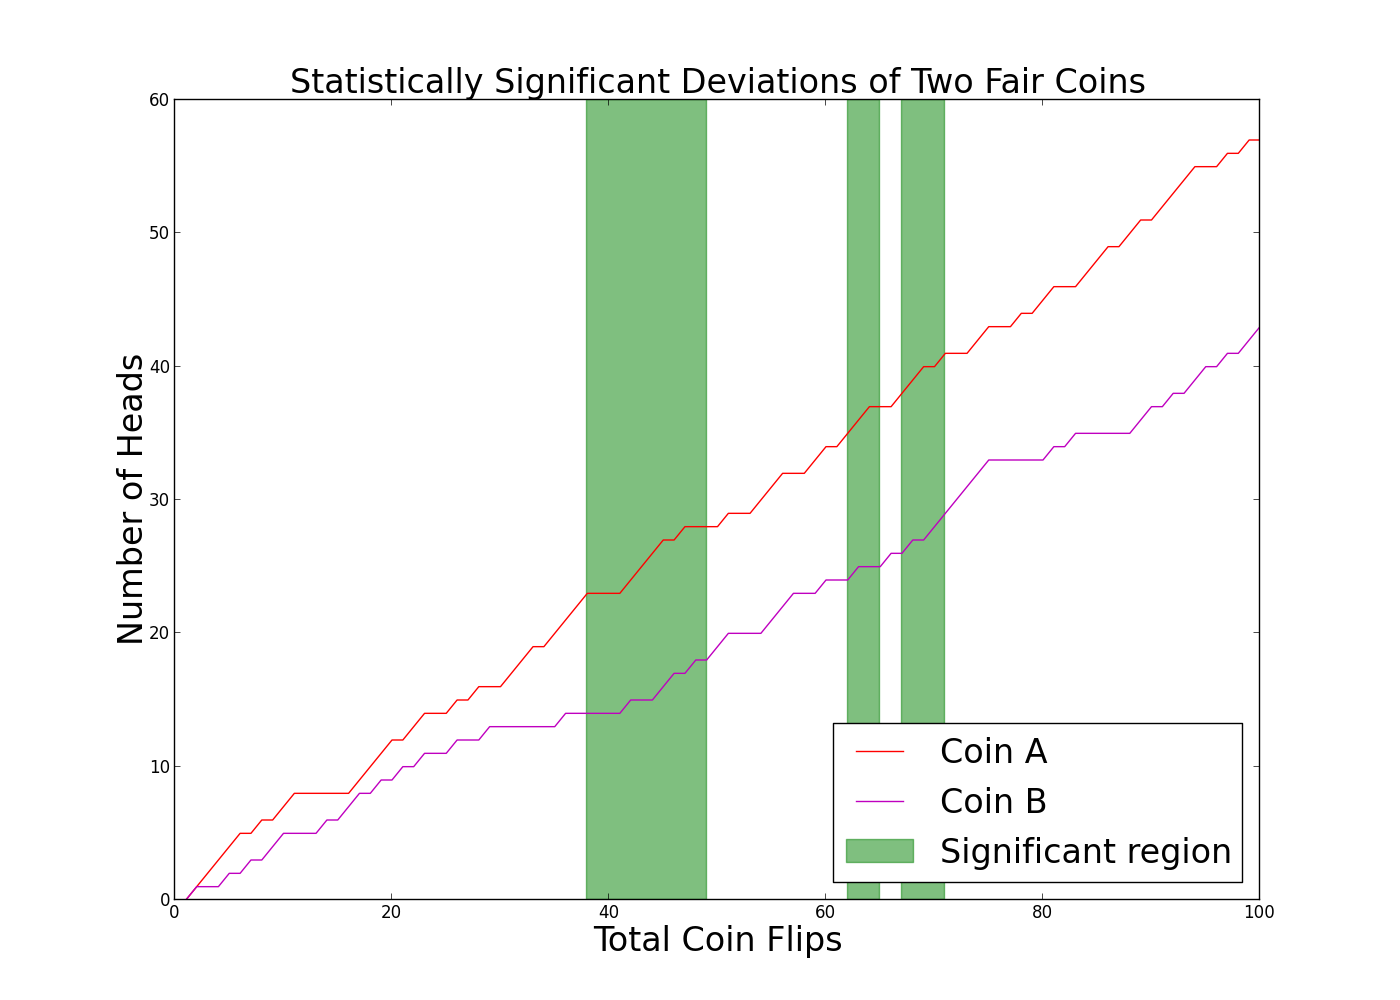
A subtler error is to do significance testing, but to halt the experiment as soon as significance is measured. This is always a bad idea, and the problem is exacerbated by trying to make decisions far too quickly. Funny business with timeframes can coerce most A/B tests into statistical significance.
A simulation of flipping two fair coins. In the green regions, the difference in the number of heads is measured to be significant. If we stopped flipping in those regions, we would (incorrectly) decide the coins were different.
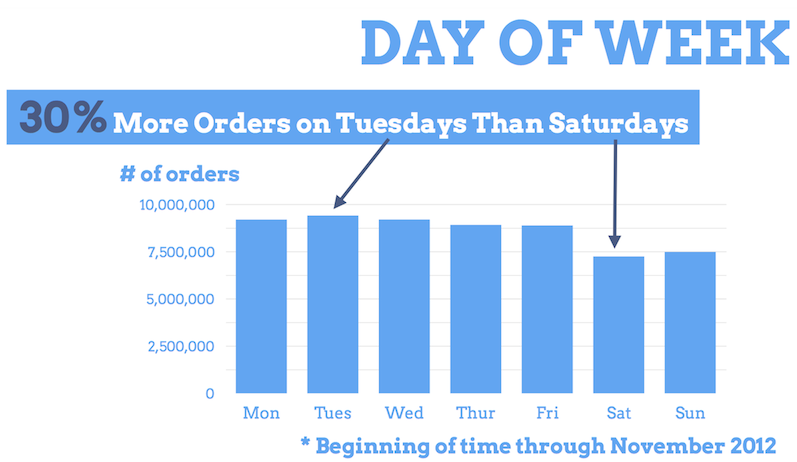
Depending on the change that’s being made, making any decision based on a single day of data could be ill-conceived. Even if you think you have plenty of data, it’s not farfetched to imagine that user behavior has its own rhythms. A conspicuous (if basic) example of this is that Etsy sees 30% more orders on Tuesdays than it does on Sundays.
While the sale count itself might not skew a random test, user demographics could be different day over day. Or very likely, you could see a major difference in user behavior immediately upon releasing a change, only to watch it evaporate as users learn to use new functionality. Given all of these concerns, the conservative and reasonable stance is to only consider tests that last a few days or more.
One could certainly have a real-time analytics system without making any of these mistakes. (To be clear, I find this unlikely. Idle hands stoked by a stream of numbers are the devil’s playthings.) But unless the intention is to make decisions with this data, one might wonder what the purpose of such a system could possibly be. Wasting the effort to erect complexity for which there is no use case is perhaps the worst of all of these possible pitfalls.
For all of these reasons I’ve come to view delayed analytics as positive. The turnaround time also imposes a welcome pressure on experimental design. People are more likely to think carefully about how their controls work and how they set up their measurements when there’s no promise of immediate feedback.
Real-time web analytics is a seductive concept. It appeals to our desire for instant gratification. But the truth is that there are very few product decisions that can be made in real time, if there are any at all. Analysis is difficult enough already, without attempting to do it at speed.
If there’s anything people are good at, it’s retrofitting events with a coherent narrative. Even, or maybe especially, when the ultimate causes of past events are the forces of chance. If you look closely you can see this everywhere.
Ancient examples abound. In Moralia, Plutarch relates an incident in which a vestal virgin was struck by lightning and killed. Although this is the definition of randomness to our ears, to the Romans this was an event of profound significance. Clearly, some sin of the surviving virgins was yet uncovered, and in time several were duly convicted of illicit offenses. Punishment for this, by the way, usually involved the offenders being buried alive. Not quite confident that they had set the universe right again, the Romans consulted their Sibylline books (for a contemporary analogue, consider Nostradamus or the Bible Code). Having done this, for good measure, they elected to also bury two live Gauls and two live Greeks.
Electrostatic discharge: just a theory.
Photo credit: Pete Hunt
The modern reader might be tempted to chuckle at this display of superstitious lunacy. But I don’t think we should be so confident that we’ve conquered this species of irrationality. It would be much too depressing for me to go on at length about the case of Cameron Todd Willingham. “Comedy equals tragedy plus time,” they say, and while ancient cruelty fits the bill, Texan cruelty doesn’t.
So let me hastily change gears and point out that a large percentage of CNBC programming is a more benign manifestation of this kind of thinking. The stock market never fluctuates up or down on a given day, the stock market sinks or rallies for a reason. And that reason invariably involves the actions of heroes and villains. One article pulled out of a hat reveals arcane symbology and slapstick levels of claimed precision:
A classic bearish head and shoulders pattern seems to suggest that further declines may be ahead. For this scenario to occur the Dow Jones will need to see a break below 12,471 to confirm we are heading lower.
And if you want another example, go check the Facebook profile of every ostensibly-atheist Brooklyn asshole you know the next time Mercury is in retrograde.
There is a school of thought in biology—and don’t ask me how widely this is accepted—that evolution favors Type II errors (“failing to reject a falsehood”) over Type I errors (“failing to accept a truth”). The argument goes like this: while there’s not much immediate consequence to believing that your dancing caused the rain, there is probably a lot of selection pressure working against animals that can’t make the connection between hearing a rattle and being bitten by a snake. This eminently practical adaption misfires in our present situation, and that makes us susceptible to the category of cognitive bias I’ve been describing. We are prone to find meaning in everything. Add a dash of salt, stir, let simmer for a millennium or two and you get the Catholic Church. Please note that I like to repeat this sermon at every opportunity, since it makes such a good story.
Practical Consequences
I am going somewhere with this, of course. For those of us attempting to do something resembling science on the web, a keen awareness of this tendency is crucial if we are to do our jobs well.
To illustrate what I mean, let me show you some real and recent Etsy data. I ran an A/B test on Etsy search pages for a while, and then I poked around to see what metrics had changed with 95% confidence or better. Here’s what I found:
Action
A
B
Change
p-value
Followed
0.55%
0.59%
-7.4%
0.022
Registered
0.46%
0.42%
+9.0%
0.022
Homepage
51.4%
51.1%
+0.48%
0.049
Item page
72.7%
72.5%
+0.31%
0.044
Action
Group A
Group B
Change
p-value
Followed another user
0.55%
0.59%
-7.4%
0.022
Registered
0.46%
0.42%
+9.0%
0.022
Viewed homepage
51.4%
51.1%
+0.48%
0.049
Viewed a listing
72.7%
72.5%
+0.31%
0.044
Given this, we can try to piece together what happened.
We can see that while fewer people in group A followed another user, many more signed up for Etsy. (This is a very interesting result, because we know that at least half of people register in order to purchase.) We also find that fewer people in group B ever managed to look at an item on Etsy. So the result seems to hint at a fundamental tradeoff between social features and commerce. We can encourage engaged users to follow each other, but this is a fringe activity, and it will put off people that show up on the site to buy things.
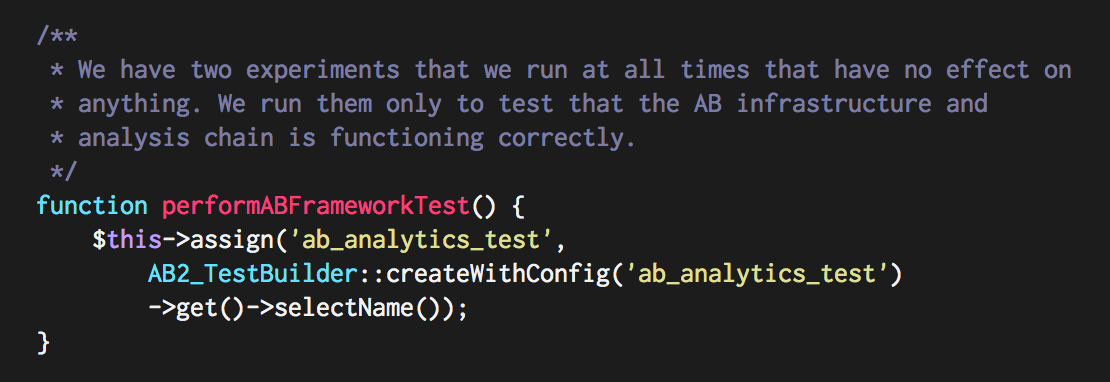
Right? No. Completely wrong. What I neglected to explain was that this A/B test does nothing. It randomly assigns visitors into group A or group B, and nothing else. Any changes that we observe in this A/B test are, by definition, due to chance. But that didn’t stop me from telling you a story about the result that I think was at least a little bit convincing. Imagine how well I might have done if we were measuring a real feature.
The world's stupidest A/B test.
The statistical mistake I’ve just made is to fast talk my way past “95% confidence” and to hide data. If we’re 95% confident of a change, then we’re 5% unsure of a change. Or to put it another way, one metric in twenty that we measure like this will be wrong. I had about a hundred metrics, and I cherrypicked four whose changes were calculated to be statistically significant.
From there, the flaws in my own software could take control and explain why this data shows that the virgin was struck by lightning because the goddess of the hearth is pissed about unchaste behavior within her sacred temple and in order to rectify this situation, we have to throw some hapless barbaris in a pit. Obviously.
Binding Oneself to the Mast
So to bring this meditation to a close, let’s reflect on how we can reduce our chances of making these mistakes. Well, first, we have to realize that by our very nature we are struggling against it every day. Check. And when our enemy is ourselves, one of the most effective countermeasures known is a Ulysses contract.
After investing some time into building a feature and testing it, we know that we’re going to have some level of emotional involvement in it. We’re only human. If we can identify specific tendencies that we’ll have in our less sober moments, we can drag ourselves back to honest assessment. Kicking and screaming, if necessary.
We may be tempted to cherrypick numbers that look impressive and appeal to our biases.
We are prone to retrofit a story onto any numbers we have. And we will believe it, even if intellectually we understand that this is a common mistake.
We can address these problems with tooling and discipline.
First, we can avoid building tooling that enables fishing expeditions. Etsy’s AB analyzer tool forces you to reveal each metric that you think might be worth looking at one at a time. There’s no “show me everything” button. Now, this may have arisen entirely by accident and laziness, but it was for the best.
This interface is appropriate, although it also sucks.
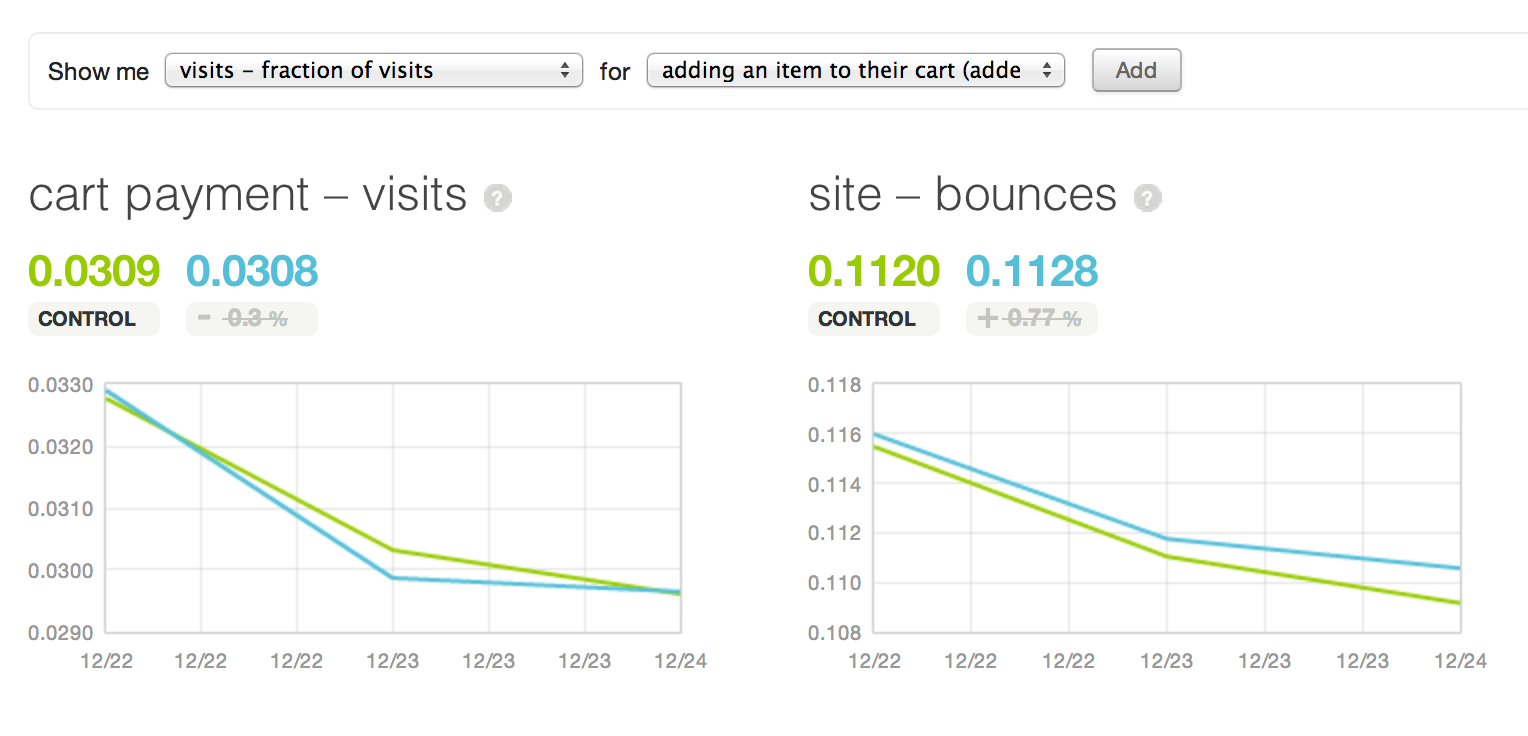
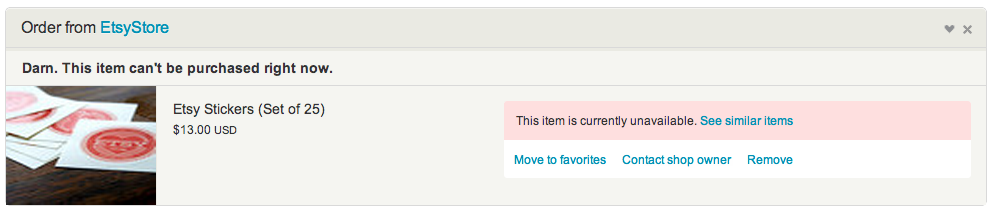
Second, we can limit our post-hoc rationalization by explicitly constraining it before the experiment. Whenever we test a feature on Etsy, we begin the process by identifying metrics that we believe will change if we 1) understand what is happening and 2) get the effect we desire. A few months ago, we ran an experiment suggesting replacements for sold or unavailable items still in user carts.
The red box was an experimental feature on Etsy.
The product manager wrote the following down at the time of launch:
We expect this experiment to reduce dead-ends on the site and to give cart visitors an avenue for finding replacements. We expect an increase in listings viewed, a decrease in exits from the cart page, and an increase in items added to carts.
Listing a combination of several expected observations is key, since every prediction reduces the odds that this will happen entirely by random chance. If the experiment results in the expected changes, we can have a high degree of confidence that we understand what is happening.
Humans are at once flawed and remarkable animals. Much as we might imagine ourselves to be rational actors, we aren’t. But we can erect frameworks in which we can compel ourselves to behave rationally.
In 2010ish, we tried to roll out a feature (Treasury) using MongoDB. It was an interesting experience. I learned quite a bit in the process. I wrote about what I was thinking at the time here. But for the most part it was an abject failure and Ryan Young wound up porting the entire thing to the MySQL shards which had come to maturity in the meantime.
Before you get too excited, the reason for the failure is probably not any of the ones you’re imagining. Mainly it’s this: adding another kind of production database was a huge waste of time.
If you want to make Mongo your only database, it might work out well for you. I can’t personally say it will definitely work out. I know that there’s plenty of talk on the internet about Mongo’s running-with-scissors-as-default and lack of single-server durability and rumors about data loss or what have you, but, none of that ever affected us. Those concerns may or may not have merit, but I personally have no experience with them.
But what I can say is that if you are considering Mongo plus another database like MySQL, then in all likelihood you shouldn’t do it. The benefits of being schemaless are negated by the pain you will feel sorting out:
Logging.
Monitoring.
Slow query optimization.
init scripts.
Graphing.
Replication.
Sharding strategy.
Rebalancing strategy.
Backups.
Restoration.
Probably like 50 other things Allspaw knows about that we developers don’t have to care about.
For two databases. In practice, you will do this for one of your databases but not the other. The other one will be a ghetto.
Substitute “figure out” with “deploy” if you want, since I’m sure people now aren’t starting from scratch on these points as we were in 2010. We were the first people in the world to attempt several of these bulletpoints, and that certainly didn’t help. But regardless, deployment takes real effort. The mere fact that Ganglia integration for Mongo might already exist now doesn’t mean that you will be handed a tested and working Mongo+Ganglia setup on a silver platter. Everything is significantly more settled in the MySQL world, but it didn’t take us zero time or energy to get our MySQL sharding to where it is today.
Mongo tries to make certain things easier, and sometimes it succeeds, but in my experience these abstractions mostly leak. There is no panacea for your scaling problem. You still have to think about how to store your data so that you can get it out of the database. You still have to think about how to denormalize and how to index.
“Auto-sharding” or not, which is something I don’t have direct experience with, you have to choose your sharding key correctly or you are screwed. Does your shard setup cluster the newest users onto a single shard? Congratulations, you just figured out how to send the majority of your queries to a single box.
Keep in mind that almost none of this is specific to MongoDB. I wouldn’t discourage anyone from trying Mongo out if they’re starting a new site, or if they’re using it for some offline purpose where these kinds of concerns can be glossed over. But if you’re trying to mix Mongo (or almost anything else) into an established site where it won’t be your only database, and doesn’t accomplish something really novel, you’re probably wasting your time.
Does it ever make sense to add another kind of database? Sure, if the work you would save by using it is not outweighed by all of the work I just described. For most purposes, it’s pretty hard to make the case that MySQL and Mongo are really sufficiently different for this to be the case.