Using LeakDiag to Debug Unmanaged Memory Leaks
December 11th, 2005
I have been getting quite a few google hits for search strings like this:
unmanaged memory leaks windbg
It’s the second-most-common combination of search terms, trailing “hank goldberg picks” by a hell of a lot. I don’t think the searches are coming from the same demographic. Anyway, I thought I would write up one of the easiest techniques that I’m aware of for debugging a memory leak in unmanaged code. This one doesn’t touch WinDbg, but rather uses a few other Microsoft PSS tools specifically built for this purpose.
For this example, I fired up the MFC wizard and created a new scratch application. To that I added some logic to leak roughly 2K of memory every tenth of a second.
    #include <vector>

    using namespace std;

    BEGIN_MESSAGE_MAP(CMainFrame, CFrameWnd)
        ON_WM_CREATE()
        ON_WM_TIMER()
    END_MESSAGE_MAP()

    // Incredibly stupid memory leak
    void CMainFrame::OnTimer(UINT_PTR nIDEvent)
    {
        UNREFERENCED_PARAMETER(nIDEvent);

        vector<int>* pvec = new vector<int>();
        for(int i = 0; i < 500; i++)
        {
            pvec->push_back(i);
        }
    }

    int CMainFrame::OnCreate(LPCREATESTRUCT lpCreateStruct)
    {
        // ...
        this->SetTimer(1, 100, NULL);
    }
Supposing we had not done this on purpose, it would be clear from looking at the process in Perfmon that we were dealing with a memory leak. The Private Bytes counter for this process grows steadily while the application is doing nothing in particular.
The tools that we’ll be using to look at this problem are LeakDiag, LDParser, and LDGrapher. You can download them all from ftp://ftp.microsoft.com/PSS/Tools/ (LeakDiag and LDParser are bundled together).
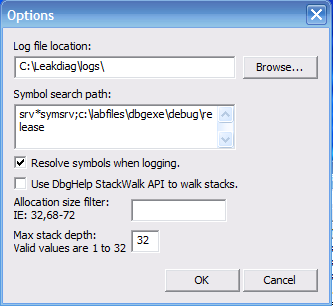
After opening the problem application, start LeakDiag.exe. In Tools->Options, we want to increase the stack depth to the maximum (32). The reason for this is because in an application written in any medium to high level language you are typically pretty far from the actual call to malloc when you are leaking memory.
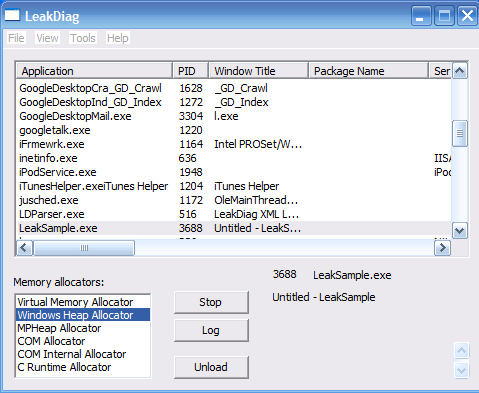
There are a few options available (on the main dialog) for the specific allocator to monitor. Several may generate hits for the same leak (The CRT malloc will ultimately call the NT APIs, for example), but try to pick the one that most describes your application. Click Start and create a few logs as the leak manifests itself. In the MFC application I wrote, the leak is occurring constantly. Your application may need to run for many hours before you can get any worthwhile data.
After doing this, you can use the LDParser application to open up one of the log files. You’ll see something like this:
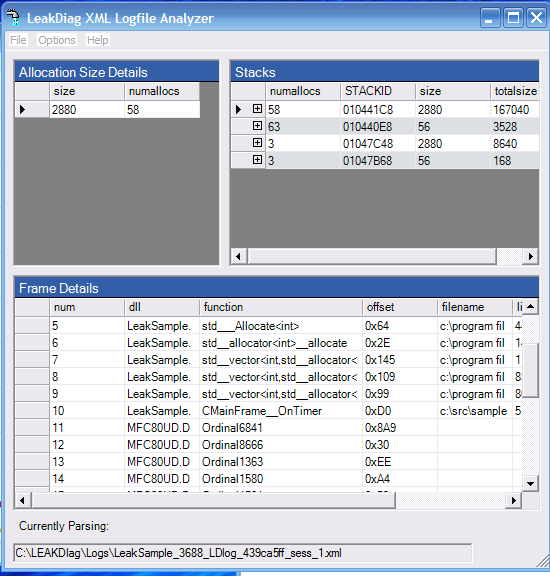
The upper-right pane is a list of unique stack traces when the specified allocator was invoked. The list should be sorted by the total amount of data allocated by each. The bottom pane shows the stack trace for the active stack ID. In my case, the stack allocating the most memory is my intentional leak (notice that CMainFrame::OnTimer is in frame ten).
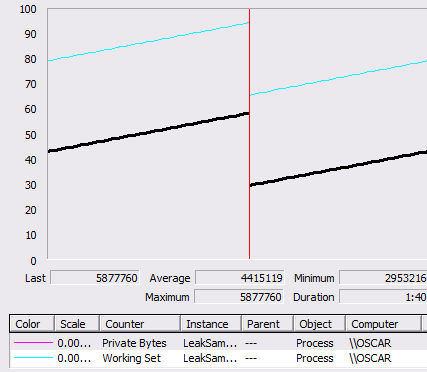
If your situation is more complicated than mine, as it almost certainly will be, there is one other tool you should be aware of. LDGrapher can take a set of logs generated by LeakDiag and generate a set of graphs of allocations over time. Here is the output of my application over a few minutes:
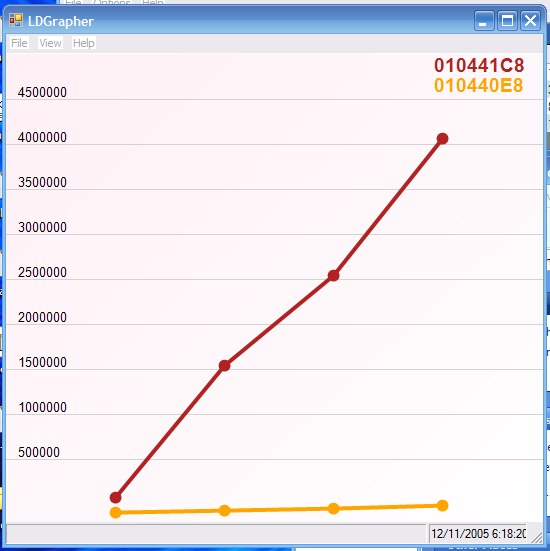
Each stack ID is represented by a line on the graph. Hopefully, this will help some of you debugging unmanaged memory leaks.
