I was writing some C# code the other day and attempted to use a static local variable. This may only be because I’ve been spending so much time with C++ recently, but I was very surprised to find that it didn’t work. “That’s a shame,” I thought. It’s not as though I use static locals every day. I’ve been using C# for a few years and I was just getting around to discovering that it doesn’t support them, after all. Nevertheless, I would say I use static locals exactly when I need them.
I was sure that VB.NET supported static locals. I thought that perhaps an Object Orientation zealot decreed that they weren’t going into C#, even though that would not be typical of the attitude exhibited in the most recent C# whitepapers. As it turns out, that’s not what happened at all. Static locals are a compiler feature, and not something implemented on the CLR level. Paul Vick explains:
Implementing static locals in the compiler was a gigantic pain in the ass, and we had a lot of arguments about whether they were worth the effort. There are times that I haven’t been entirely convinced about it, but I think my thoughts on this are changing…
I suppose I have already conceded that there are more important things to spend time on. In the same post Paul discusses the relative merits of the keywords in either language.
We also felt that “Shared” is a lot more descriptive than “Static,” and I wonder whether C# would have chosen that term if they hadn’t been stuck with the legacy of C, but… This is probably the most painful keyword divergence between the two languages in terms of documentation.
Something of a silly discussion, I think, since VB is teeming with its own historical oddities (to wit: Dim intArray(0) As Integer). But this does remind me of a story.
A while back I was debugging an odd issue where users of a web application were seeing each other’s data “randomly.” Our application has a set of links on one side of it that are customized to relate to the entity the user is viewing. A typical bug would be:
The top half of the links relate to entity ‘A’ (which is the right one), but the bottom half of the links relate to entity ‘B,’ which I was not looking at.
Compared to some other bugs I have worked on, this one was a piece of cake. I figured out pretty quickly that the developer of the control in question had written a big section of variables that looked like this:
Public Shared A As Integer
Public Shared B As String
Public Shared C As String
' ...;
These were used in the process of rendering the hyperlinks. I asked the developer why he’d done this, but he didn’t know why. He had just seen the word “Shared” associated with member declarations in the past and thought that he needed to put it there.
He was typically more informed about keywords than this, so telling him that Shared was like “static” in other languages brought instant recognition. In fact he changed the code so that it looked like this (I’m doing this from memory, but I think this is pretty faithful to the original treasure):
' Shared == Static!! Shared variables are static!
Public A As Integer
Public B As String
Public C As String
' ...;
I’m going to take a page from the Book of Darrel and post some design patterns whenever I realize that I’m using them. I’d like to be careful because I think that there are a few camps when it comes to design patterns:
- Design patterns are very important, very specific, and are a great thing to quiz people about in an interview.
- Design patterns are more fluid, something that is figured out when you’re factoring code. There is no way you will not discover these on your own.
I lean to the second category. The quizzers may know little else (you’ll see the same attitude with plenty of other development topics).
Now that you know how to take my writing about design patterns, let’s suppose that you want to make a Windows form that becomes a little translucent when it is inactive. That may or may not be annoying, but there is a very straightforward way to make it happen:
    // Form that becomes transparent when it is inactive
    public class Foo : Form
    {
        private const double c_InactiveOpacity = 0.25d;
        private double _prevOpacity;

        protected override void OnDeactivate(EventArgs e)
        {
            _prevOpacity = this.Opacity;
            this.Opacity = c_InactiveOpacity;
            base.OnDeactivate(e);
        }

        protected override void OnActivated(EventArgs e)
        {
            this.Opacity = _prevOpacity;
            base.OnActivated(e);
        }

        public Foo()
        {
            _prevOpacity = 1.0d;
        }
    }
Which works fine, unless you want TWO forms that do that, the second with a special base class not related to the heirarchy of the first.
public class Foo2 : SpecialForm
{
    // criminy
}
This conundrum could be resolved in a few ways:
- Ctrl+C, Ctrl+V.
- Multiple base classes.
- What I am going to call the “Extender Pattern.”
If you picked the first option, I think it’d be better for both of us if you unsubscribed from my feed. The second option would work fine, but CLR languages don’t support it. Some days this bothers me, but most days I think it’s a good thing. Especially when I factor a solution that is just as elegant.
I’m calling that solution the “Extender Pattern” without bothering to find out if anyone has used this term to describe anything else. As I explained above, this is more about artistic sensibility than it is about hard rules and book learning. Not that I’m anti-book learning.
The basic idea is this: you have a set of components that support certain properties, methods, and events. The forms, in this case. You add in to the mix a set of small objects whose only responsibility is to wait for events from the components and make very directed changes to them.
So here is such a class for the problem stated above:
    // Alters the target form's transparency level
    // when it is activated/deactivated.
    public class TransparencyExtender
    {
        private Form _target;
        private double _prevOpacity;
        private const double c_opacity = 0.25d;

        public TransparencyExtender(Form target)
        {
            _target = target;
            _prevOpacity = target.Opacity;
            target.Activated +=
                 new EventHandler(Activated);
            target.Deactivate +=
                 new EventHandler(Deactivate);
        }

        void Deactivate(object sender, EventArgs e)
        {
            _prevOpacity = _target.Opacity;
            if (_prevOpacity >= c_opacity)
            {
                _target.Opacity = c_opacity;
            }
        }

        void Activated(object sender, EventArgs e)
        {
            _target.Opacity = _prevOpacity;
        }
    }
Given this, we can write our forms very easily:
    public class Foo : Form
    {
        private TransparencyExtender _tExt =
            new TransparencyExtender(this);
    }

    public class Foo2 : SpecialForm
    {
        private TransparencyExtender _tExt =
            new TransparencyExtender(this);
    }
Keep in mind that I am not claiming that this is original. It’s really the same as a small secondary base class in C++. However, I think there’s value in looking at the same problem in different ways.
In a real application I’m working on, I’ve written a handful of other window/control styles that can be applied and removed on the fly or from the designer. Again, not original, but I like my little framework. Perhaps I’ll post this someday, or turn it into a product.
I like event/message-driven programming the more I try to use it. I’m using Windows Forms as an example here, but it would be wrong to assume that’s the only place this could be applied. I’ve done the same kinds of things in ASP.NET.
I have been getting quite a few google hits for search strings like this:
unmanaged memory leaks windbg
It’s the second-most-common combination of search terms, trailing “hank goldberg picks” by a hell of a lot. I don’t think the searches are coming from the same demographic. Anyway, I thought I would write up one of the easiest techniques that I’m aware of for debugging a memory leak in unmanaged code. This one doesn’t touch WinDbg, but rather uses a few other Microsoft PSS tools specifically built for this purpose.
For this example, I fired up the MFC wizard and created a new scratch application. To that I added some logic to leak roughly 2K of memory every tenth of a second.
    #include <vector>

    using namespace std;

    BEGIN_MESSAGE_MAP(CMainFrame, CFrameWnd)
        ON_WM_CREATE()
        ON_WM_TIMER()
    END_MESSAGE_MAP()

    // Incredibly stupid memory leak
    void CMainFrame::OnTimer(UINT_PTR nIDEvent)
    {
        UNREFERENCED_PARAMETER(nIDEvent);

        vector<int>* pvec = new vector<int>();
        for(int i = 0; i < 500; i++)
        {
            pvec->push_back(i);
        }
    }

    int CMainFrame::OnCreate(LPCREATESTRUCT lpCreateStruct)
    {
        // ...
        this->SetTimer(1, 100, NULL);
    }
Supposing we had not done this on purpose, it would be clear from looking at the process in Perfmon that we were dealing with a memory leak. The Private Bytes counter for this process grows steadily while the application is doing nothing in particular.
The tools that we’ll be using to look at this problem are LeakDiag, LDParser, and LDGrapher. You can download them all from ftp://ftp.microsoft.com/PSS/Tools/ (LeakDiag and LDParser are bundled together).
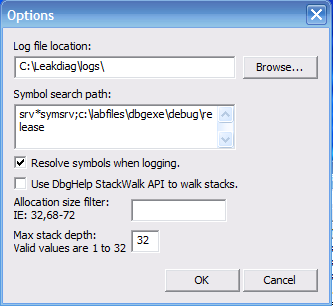
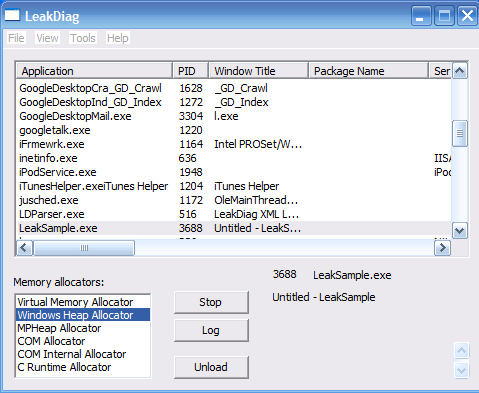
After opening the problem application, start LeakDiag.exe. In Tools->Options, we want to increase the stack depth to the maximum (32). The reason for this is because in an application written in any medium to high level language you are typically pretty far from the actual call to malloc when you are leaking memory.
There are a few options available (on the main dialog) for the specific allocator to monitor. Several may generate hits for the same leak (The CRT malloc will ultimately call the NT APIs, for example), but try to pick the one that most describes your application. Click Start and create a few logs as the leak manifests itself. In the MFC application I wrote, the leak is occurring constantly. Your application may need to run for many hours before you can get any worthwhile data.
After doing this, you can use the LDParser application to open up one of the log files. You’ll see something like this:
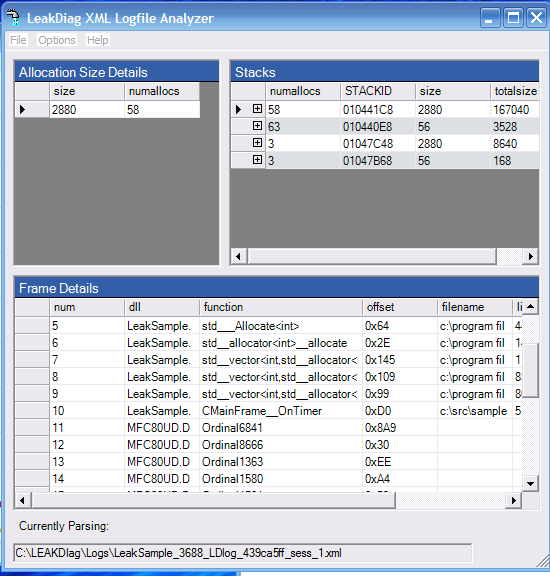
The upper-right pane is a list of unique stack traces when the specified allocator was invoked. The list should be sorted by the total amount of data allocated by each. The bottom pane shows the stack trace for the active stack ID. In my case, the stack allocating the most memory is my intentional leak (notice that CMainFrame::OnTimer is in frame ten).
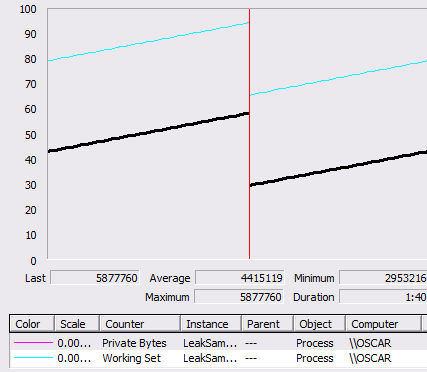
If your situation is more complicated than mine, as it almost certainly will be, there is one other tool you should be aware of. LDGrapher can take a set of logs generated by LeakDiag and generate a set of graphs of allocations over time. Here is the output of my application over a few minutes:
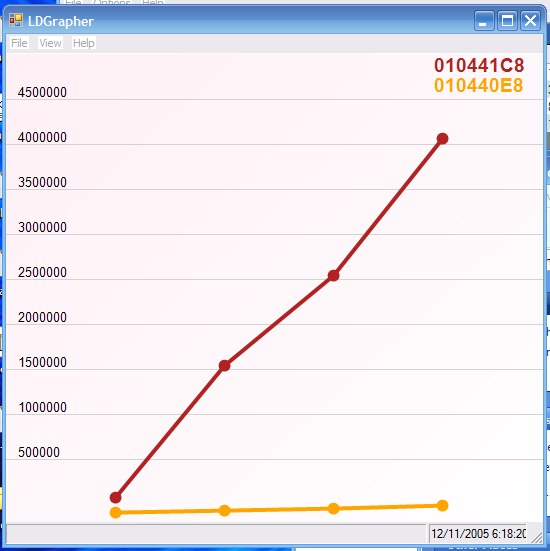
Each stack ID is represented by a line on the graph. Hopefully, this will help some of you debugging unmanaged memory leaks.
