This is something I typed up internally, to help resolve the confusion that precipitates when Visual Studio begins stepping through comments. Hopefully this will be helpful to someone else.
What is required for source mode debugging?
- Binaries (.dll, .exe, .ocx, …).
- Symbols (the .pdb file).
- Source files.
The symbol files tell your debugger how points in the binary relate to the source files. When you set a breakpoint in a source file, the debugger uses the symbol file to look up the corresponding instruction in the binary.
I have all of these things. Why is my debugger behaving strangely or not working at all?
Well, there are a bunch of different things that can go wrong.
Your symbols might be mismatched.
You can’t (as an example) use the symbols for version 2.0 of a DLL to debug version 1.0 of that DLL. Perhaps, in this case, you have copied a new binary into your run directory without copying the corresponding .pdb file. It’s also possible that your IDE or compiler did that for you.
Some debuggers, like WinDbg, will NOT load a mismatched PDB unless you force this to happen. Others, like Visual Studio 2003, will do this without so much as a complaint. That can be very confusing in some situations.
The module you are trying to debug is not loaded into the process.
If you are attempting to hit a breakpoint, a good sanity check is to make sure that the module you are trying to debug is being loaded. If it isn’t, you are experiencing something other than a PDB problem. For example, your application could be experiencing an exception before your code is called. Make sure you have “break on exceptions” turned on.
In Visual Studio, you can look at the “modules” window to make sure your binary is loaded. The corresponding command in WinDbg is lm.
You are attached with the wrong debugger.
This is another non-symbol issue. There are many different kinds of debuggers:
- Native debuggers: cdb, ntsd, windbg, Visual Studio.
- CLR debuggers: cordbg, mdbg, deblector, Visual Studio.
- Oddballs: the VB6 IDE, VS.NET’s script debugger, etc.
You should make sure you are attaching to or starting your process using the right kind of debugger. Visual Studio gives you a dialog to choose the appropriate debugger(s).
The source file is not recognized.
Say I build a .dll from c:\foo\x.cpp, and you take that library from me and try to set a breakpoint in c:\bar\x.cpp. You might need to tell the debugger that your source path is different. Visual Studio is usually pretty good at figuring this out on its own and/or asking you when it is having a problem.
The _NT_SOURCE_PATH environment variable is honored as a search path for source files by most of the Windows debuggers. The .srcpath command in WinDbg/CDB can be used to display and change the source search path in those debuggers.
The symbols are corrupt.
This is rare, but it can happen. The fix is usually to just rebuild the binary and regenerate the PDB.
The binary is not debuggable.
.NET assemblies have the added limitation that they must be built in /debug mode for conventional CLR debugging to work. You can tell if a module is debuggable by opening it up in Reflector or ILDASM. You should see this attribute:
[assembly: Debuggable(true, true)]
Where does the debugger get the symbols?
Most Windows debuggers work like this:
- The folder containing the binary is searched for a matching PDB.
- The debugger’s symbol search path is then searched. Most Windows debuggers (including Visual Studio) take their default search path from the
_NT_SYMBOL_PATH environment variable.
- How can I tell where the debugger is getting its symbols?
In WinDbg/CDB, the !sym noisy command can be used to show verbose output when the debugger is trying to resolve symbols. Visual Studio 2005 shows the symbol path as a column in the Modules window.
I am not aware of a simple way to identify where Visual Studio 2003 is loading its symbols from. The easiest way might be to use the handle utility from Sysinternals
C:\src> handle foo.pdb

Handle v3.01
Copyright (C) 1997-2005 Mark Russinovich
Sysinternals - www.sysinternals.com

devenv.exe      pid: 4832   C:\WINDOWS\Microsoft.NET\Framework\v1.1.4322\Temp
orary ASP.NET Files\someapp\dbf846f9\1ab0397c\assembly\dl2\c33a0bcb\eca89e48_3
b78c601\foo.PDB:
In this case ASP.NET has copied the binary and the PDB to a temporary location. This is another way a PDB can wind up being mismatched.
How are PDB’s matched to binaries?
The short version: the PDB contains a date stamp and a checksum which is matched against the binaries.
How can I tell if a PDB matches a binary?
The symchk utility that comes with the Debugging Tools for Windows can be used to do this. There are many options for this utility, so you should read the output of symchk /?.
Blocked finalizer threads have gotten some recent publicity on Tess Ferrandez’s blog. I recently ran into this myself, although the particulars were slightly different.
Our problem was manifesting itself in a very long-running console application that both connected to a database and made web service calls. Eventually the app would start hitting OutOfMemoryExceptions. (Completely unrelated to these OutOfMemoryExceptions. We have a high incidence of OutOfMemoryExceptions around here.)
Fixing the Wrong Problem and Moving the Goalposts
My initial reaction to this problem was (sensibly, I think) to attempt to reduce the amount of memory that the application was using. I admit that I was also focused on different problems at the time, so any makeshift solution I could get to work here would have been just fine with me.
We threw in some buffer pools, et cetera, and managed to get the app running slightly longer, but the OOM’s always resurfaced. Every time they did, the heap looked completely different due to the semi-drastic changes we were making to the app’s memory profile. After the third or maybe fourth change it dawned on me that perhaps we were just confusing the real issue.
The Proverbial Lightbulb Over the Head
The turning point came when I noticed that most of the overly-abundant objects on the heap in a particular dump were types that were likely to be associated with finalizers.
0:000> !dumpheap -stat
------------------------------
...
2,431,972    48,639,440 System.Threading.WaitHandle/__WaitHandleHandleProtector
...
This hadn’t been the case in the previous dumps. Those were eaten alive by byte arrays and strings. By this point, we had done such a fantastic job of optimizing the application for memory usage that the problem came more clearly into focus.
The Road to Victory
At this point I used !threads in SOS to locate the finalizer thread (some useless info trimmed out here):
0:000> !threads
ID APT   Exception
0  STA System.OutOfMemoryException
4  MTA (Finalizer)
Thread 4 was stuck in a WaitForSingleObject and, not unrelated to the problem here, the native stacks of almost all of the other threads in the process were in some variation of “WaitUntilGCComplete.” Probably should have noticed that sooner. So sue me.
Anyway, the top of the finalizer’s stack was interesting:
0:004> ~4k
ChildEBP RetAddr
00f0f658 7c822124 ntdll!KiFastSystemCallRet
00f0f65c 77e6baa8 ntdll!NtWaitForSingleObject+0xc
00f0f6cc 77e6ba12 kernel32!WaitForSingleObjectEx+0xac
00f0f6e0 776c54ef kernel32!WaitForSingleObject+0x12
00f0f6fc 77789905 ole32!GetToSTA+0x6f
00f0f71c 77787ed7 ole32!CRpcChannelBuffer::SwitchAptAndDispatchCall+0xcb
The finalizer is waiting to make a call over to an STA thread. Why’s it doing that? And wait, what STA thread? Funny you should ask.
Visual Basic Complications
No technical problem at my post-VBScript company would be complete without Visual Basic putting a unique spin on things. This one is no exception. The authors of this app are fairly oblivious to COM apartments and didn’t intentionally create any STA threads. They also weren’t using COM Interop directly.
So how did thread zero end up being an STA thread (the astute among you may have noticed this in the !threads output above)? The MSDN documentation seems to clearly say that MTA is the default.
The reason was that the app was written in Visual Basic. If the Main() method in a VB program is lacking the STAThreadAttribute and the MTAThreadAttribute, the VB compiler will stick an STAThreadAttribute on it for you when the MSIL is emitted (the C# compiler doesn’t do this). Presumably—and I’m guessing here but I think this is a good guess—this is done for compatibility with VB6.
The main thread of this application was sleeping the vast majority of the time. Admittedly, this is not a fantastic example of multithreaded design, but it wouldn’t have caused any problems if the thread were MTA. As Raymond has pointed out, sleeping on an STA thread can have some ill effects.
The Fix
This problem was solved by decorating the main method with <MTAThread()>. This is possibly the smallest fix to an apparently massive problem I have ever personally witnessed.
How to Notice This Problem Much Sooner
There are a few ways this could have been less painful. The easiest might have been to check the output of SOS’s !finalizequeue command. If I had done that I would have seen the following (again trimmed for clarity):
Heap 0
generation 0 has 0 finalizable objects
generation 1 has 0 finalizable objects
generation 2 has 11,212 finalizable objects
Ready for finalization 1,163,295 objects
Which does not look healthy. Looking more closely at the native stacks would have also probably yielded a solution on day one.
When I’m writing a GUI or a multithreaded server application, I make heavy use of OutputDebugString (and various API’s that map to it). This is a very useful tool when the act of stepping through an application has side effects that drastically change the experiment. Unfortunately, it looks everyone else likes this API, too.
I try to be courteous and pay my developer taxes here—when my application is deployed to customers, rest assured that it will not be writing debugger output by default. I put my calls to OutputDebugString on a switch in one way or another, or I just compile them out in release mode.
(This is not just being kind to anyone trying to debug something else on a machine running my application. I need to do this to avoid embarrassment. I curse quite a bit in my traces.)
Not everybody is taking the trouble to do this. To wit:
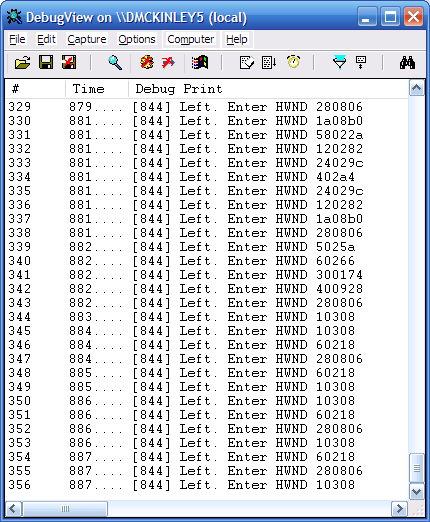
If I open up dbmon or debugview and wave my mouse around a little, i’m inundated with messages from these applications:
- Visual Studio 2005 [by far the worst].
- Visual SourceSafe [a close second place].
- Trillian
- The remnants of Symantec products that I have not yet succeeded in disabling.
I find it particularly annoying that my development tools are hampering my development in this way.
